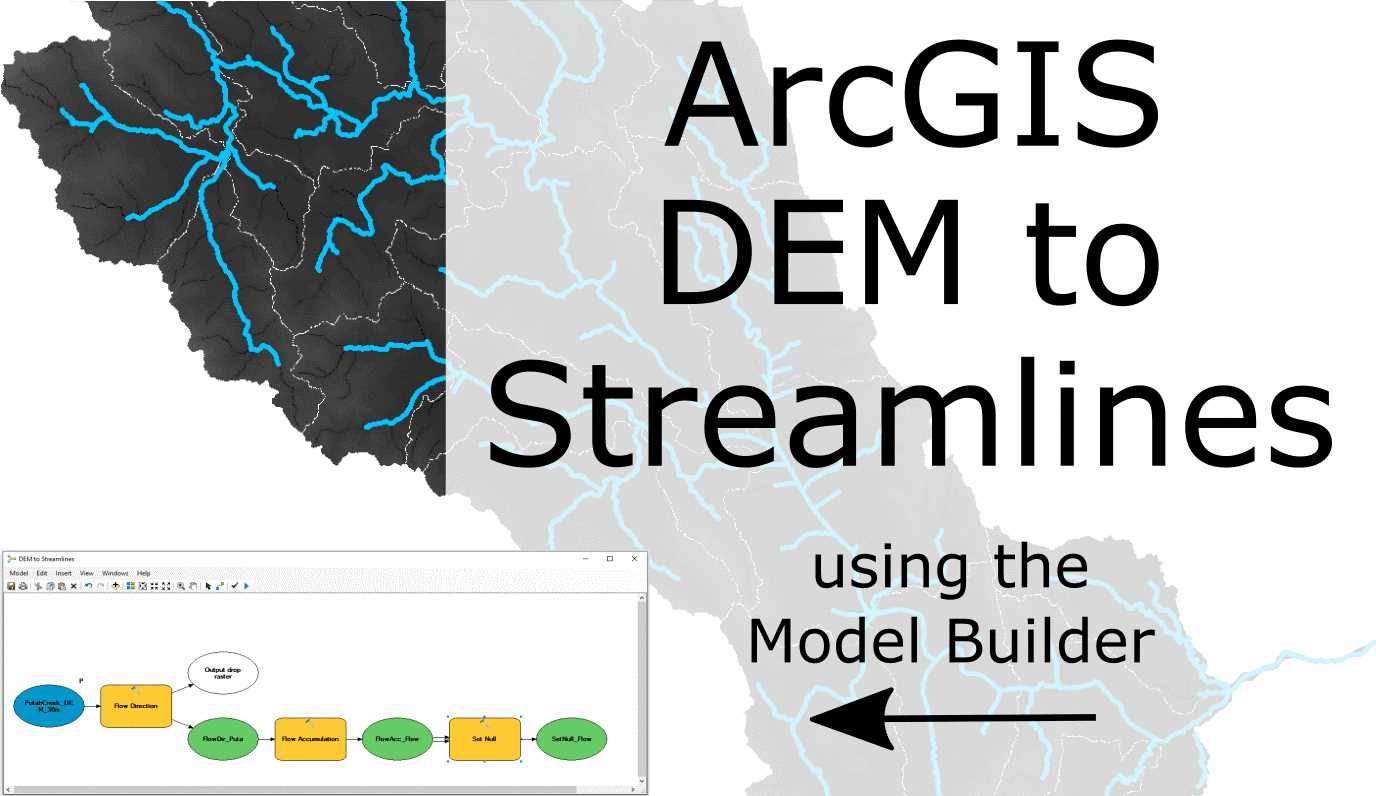
DEM to Streamlines using the Model Builder
Automate the Boring Stuff
- Introduction
- Step 1: New Toolbox
- Step 2: New Model
- Step 3: Raster Flow Direction
- Step 4: Flow Accumulation
- Step 5: Generating Streamlines
- Step 6: Add SQL Expression
- Step 7: Stream Link
- Step 8: Create a Feature
- Step 9: Finishing Touches and Trial Run
- Step 10: Validation
Introduction
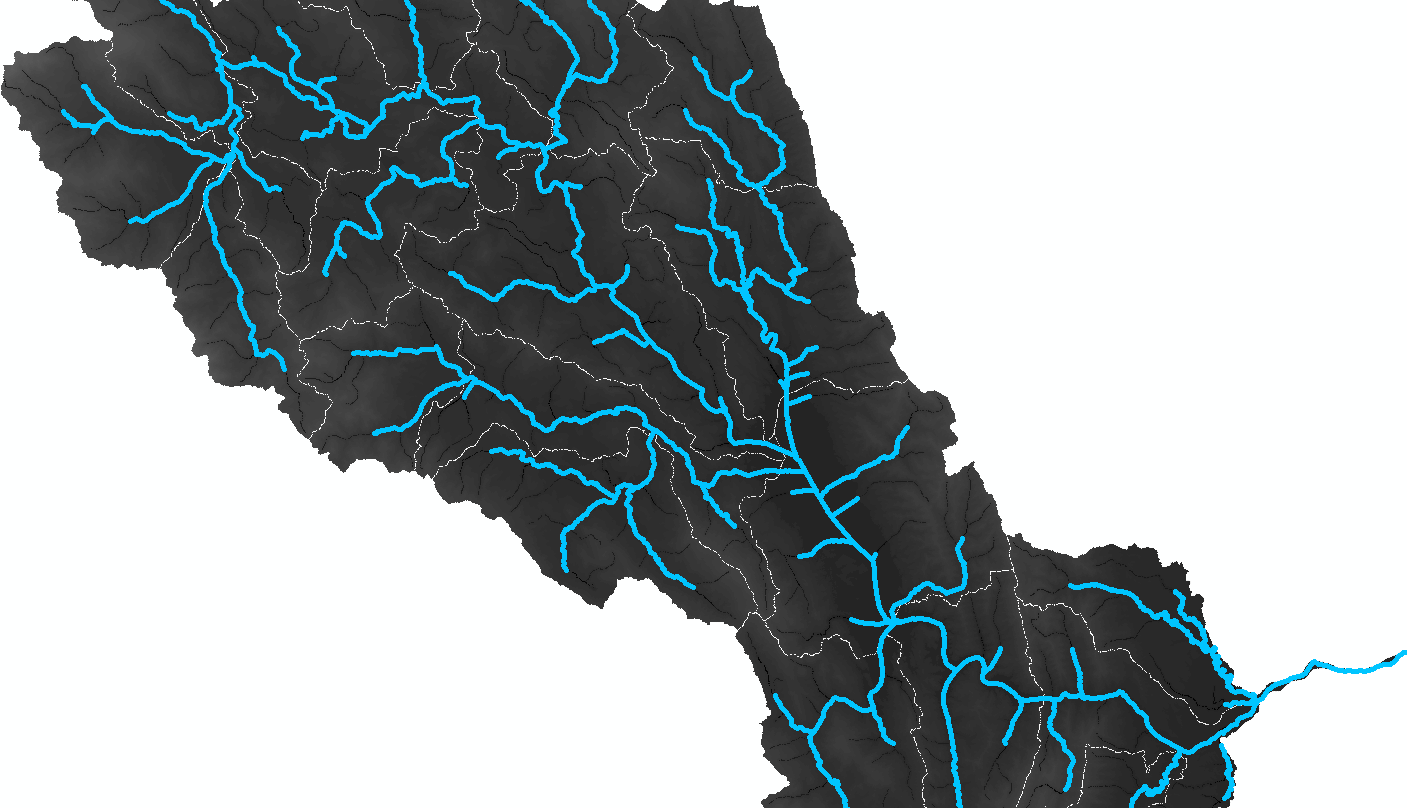
Many tasks in ArcGIS can be tedious, time-consuming, and require repeated execution. Here I show how streamlines can be calculated from a DEM model that could for example have been created previously from LIDAR data (Part I). Series of different geoprocessing tools can be run automatically by stringing them together in the Model Builder, and save the Model for future execution.
Building re-usable models for geoprocessing tasks will save time and eliminate human error. Any chain of tasks can be automated, however in the following we will build a DEM to Streamlines model step by step. Starting point is a DEM raster layer. The example I will use is a hydrologically conditioned DEM in which sinks that not exist in nature (bugs in the DEM) are filled, streams are “burned”, and ridges are “fenced”. See for information on this processing here in a slideshow by ESRI.
Step 1: New Toolbox
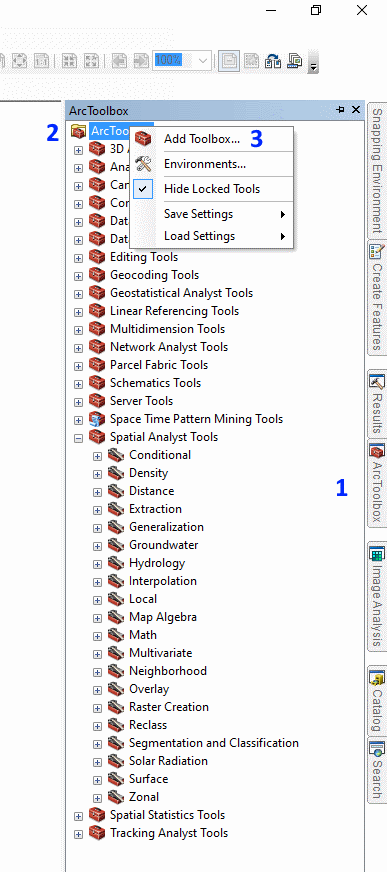
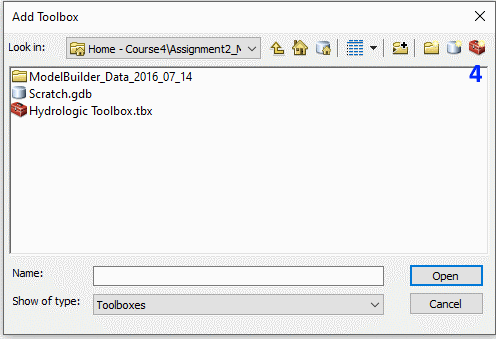
Let’s get right into the creation of the streamlines with the Model Builder and create a new custom toolbox. Open the Geoprocessing pane called ArcToolbox (1). Right click on the top entry also called “ArcToolbox” (2) and then select “Add Toolbox” (3). The toolbox will be like a folder for models we will create soon. Select the folder you want to save the toolbox and then click the small icon of a red toolbox with a star in the top right corner (4) and give it a descriptive name such as “Hydrologic Tools”.
Now we will add the newly created toolbox, hence repeat steps 1-3, select the new toolbox, and click “Open”. The “Hydrologic Tools” will now appear among with all the other ArcGIS built-in toolboxes. Great.
Step 2: New Model
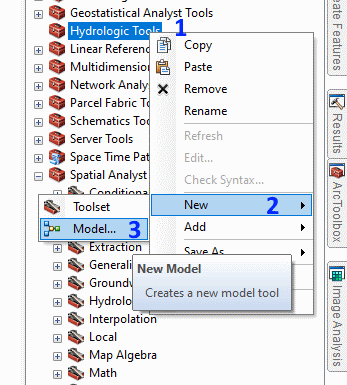
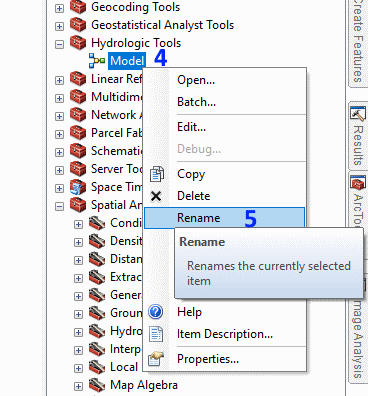
Create the model. Right click on the new toolbox (1) and select “New” (2) and “Model” (3). Ignore the popup for a moment and close it we will get back to it in the next step. Right click on the new model (4) and then “Rename” (5) to change the name from the default to “DEM to Streamlines”.
Step 3: Raster Flow Direction
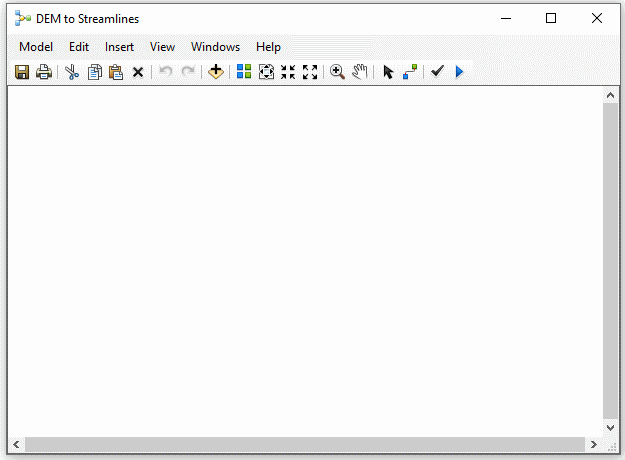
Everything is set now to get going. Double clicking will start the model like any other tool, but we first have to customoze our model. Hence, right click and click “Edit” and we are back at the empty Model Builder screen from last step. We will fill this empty screen with tools that we are going to chain together.
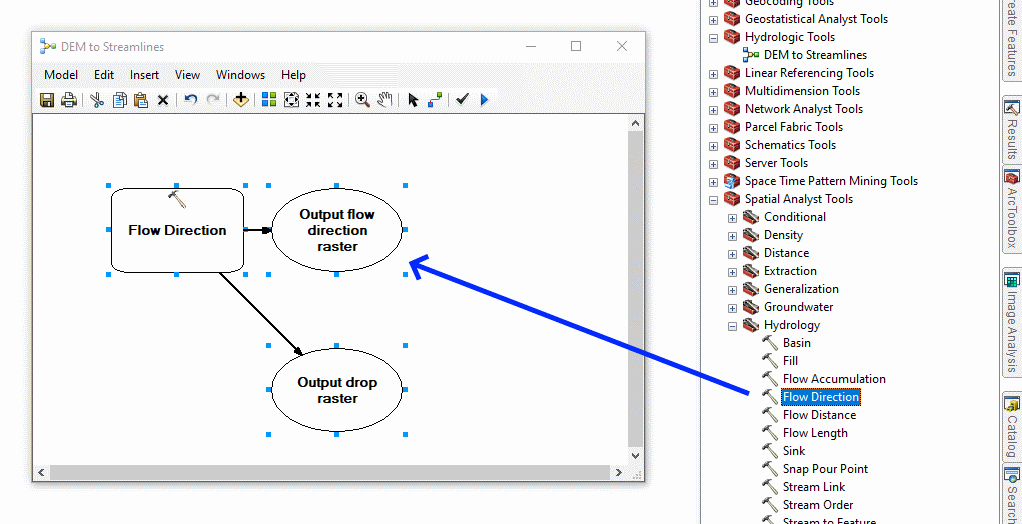
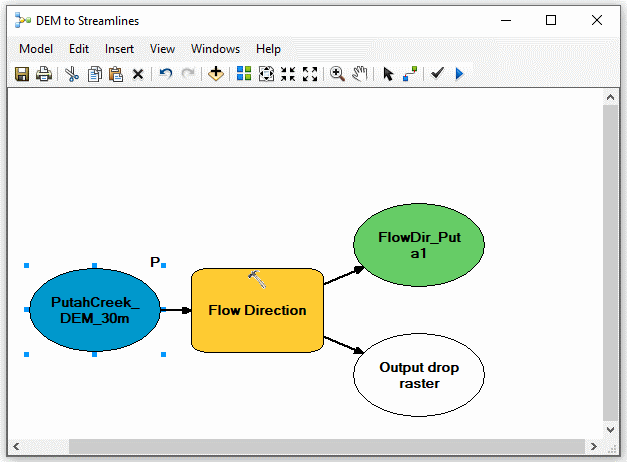
The first process will be the “Flow Direction” tool, which creates a new raster flow direction from each cell to its downslope neighbors. Drag the “Flow Direction” tool rom the ArcToolbox into the Model Builder (“Spatial Analyst” and then “Hydrology”). Notice that tools are rectangular shapes and inputs / outputs are oval shapes. Not that in this state all the shapes are white.
Double click on the “Flow Direction” tool to set Input Surface Raster to your DEM and then click OK. If everything went right, the tool will now be colored, which means it is ready to run. In future, we want that we can define the input raster for the model. To achieve that, we can right click on the Input oval and select “Model Parameter”. A little P should appear on the top right of the oval. Great.
Step 4: Flow Accumulation
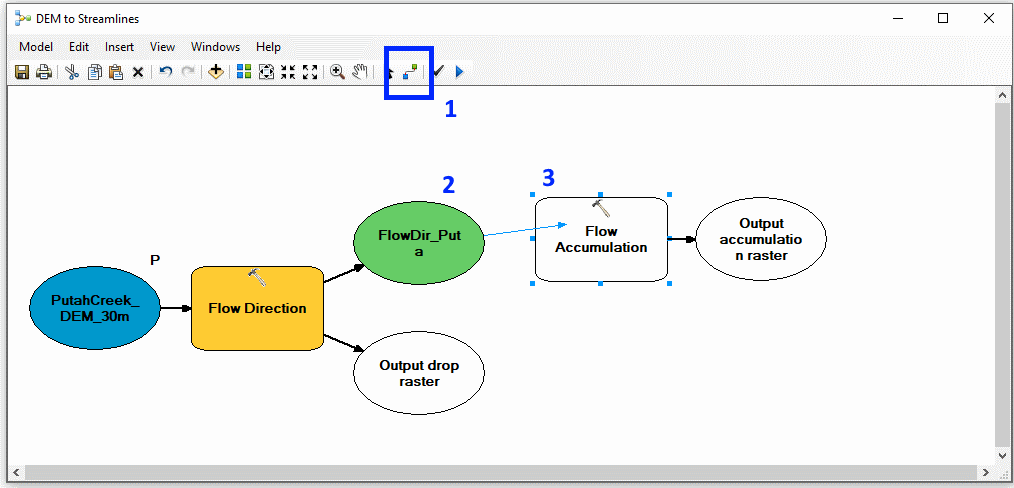
Next, let’s add the second tool, the “Flow Accumulation” tool, which is in the same sub-category as the “Flow Direction” tool before. Drag it into the Model Builder as before and drop it to the right of the “Flow Direction”. What does it do? It creates a raster of accumulated flow into each cell.
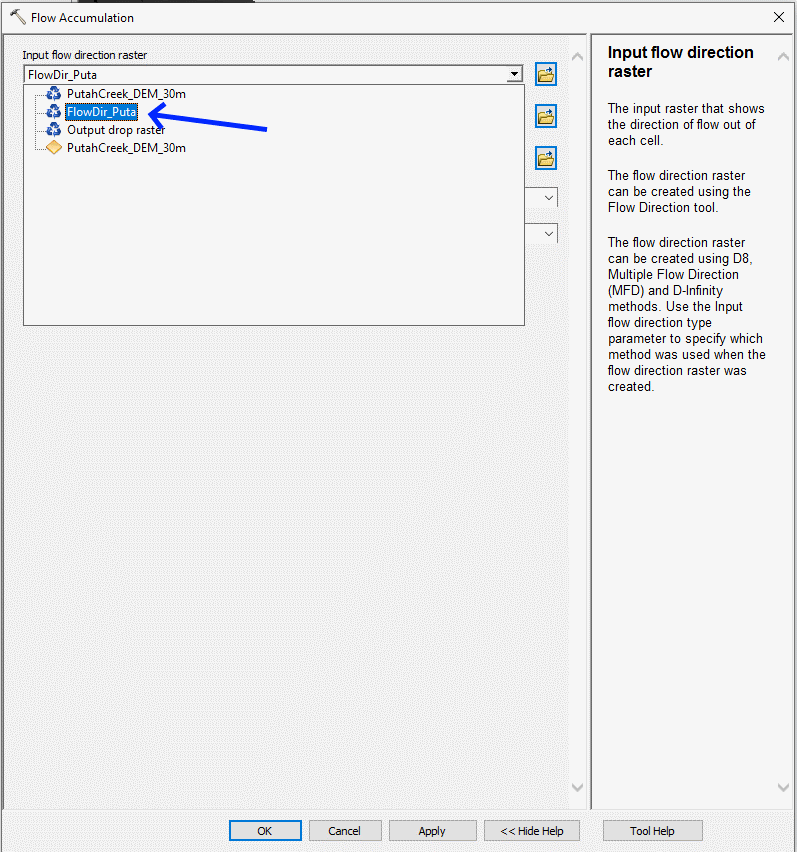
Connecting the two can be done two ways: The first way is using the “Connect” tool (1) and first click on the previous output (2) and then on the “Flow Accumulation” box (3). Select Input Flow Direction Raster when the selection pops up. The second way to make the connection is by double clicking on the “Flow Accumulation” tool and selecting the FlowDir ouptput from the dropdown. If everything went right, all boxes should be colored once again. And do not worry about neatness in arranging the objects. We will use the Model Builder’s tidy-up feature in the end.
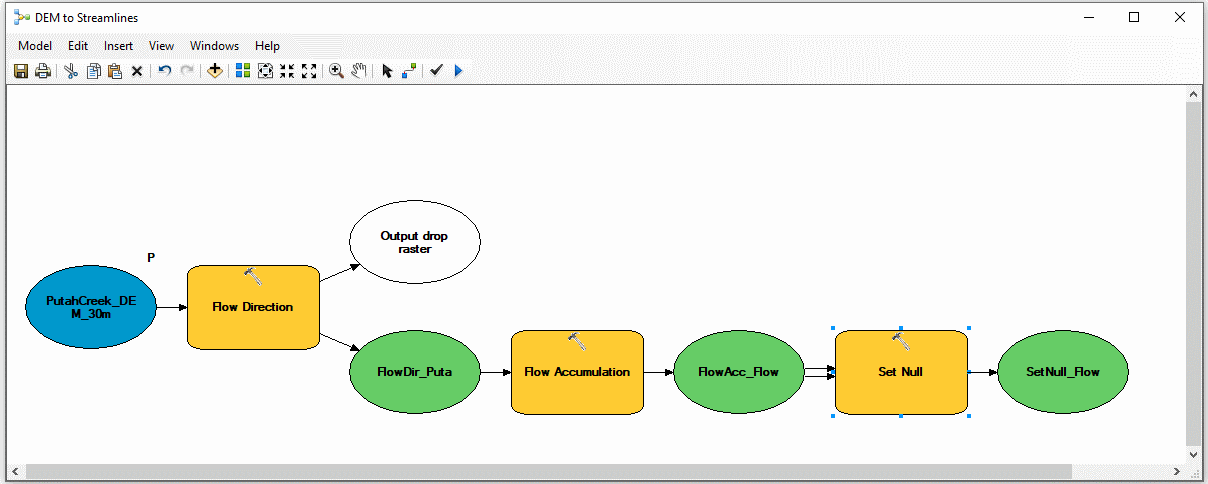
Step 5: Generating Streamlines
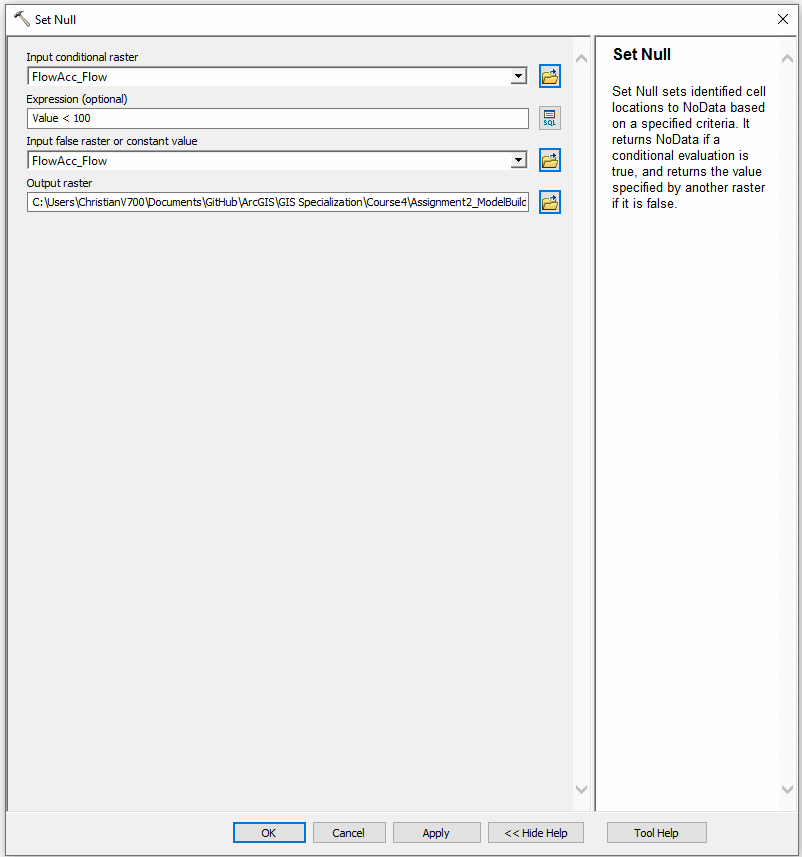
In this step we are going to define how large the accumulation will be to generate a streamline based on a condition we define. Go in the ArcToolbox to “SpatialAnalyst”, “Conditional” and then “SetNull”. Again, drag it to the right hand side of the output and then connect the output to the tool shape in your preferred way. In the settings to “SetNull” we have two more things to define. First, the Expression, which is SQL based. Enter “Value < 100” without quotation marks. This expression is going to be evalued, and all accumulation values below 100 will be TRUE and set to null. Second under “Input false raster or constant value” set the Accumulation output raster. That means if the expression is evalued FALSE, and the value is larger than 100, the original value remains.
Click OK, and all boxes should be colored again.
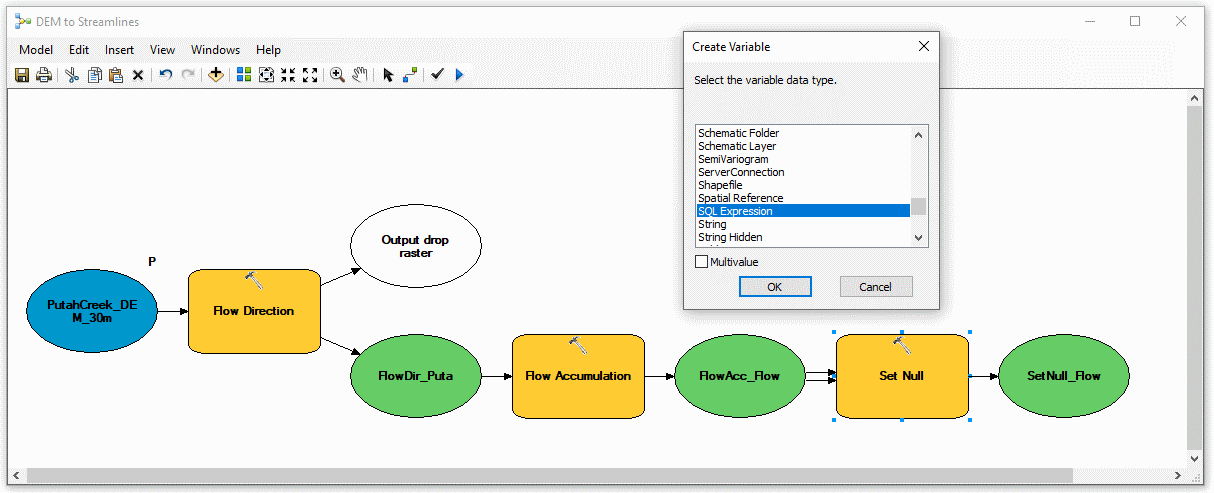
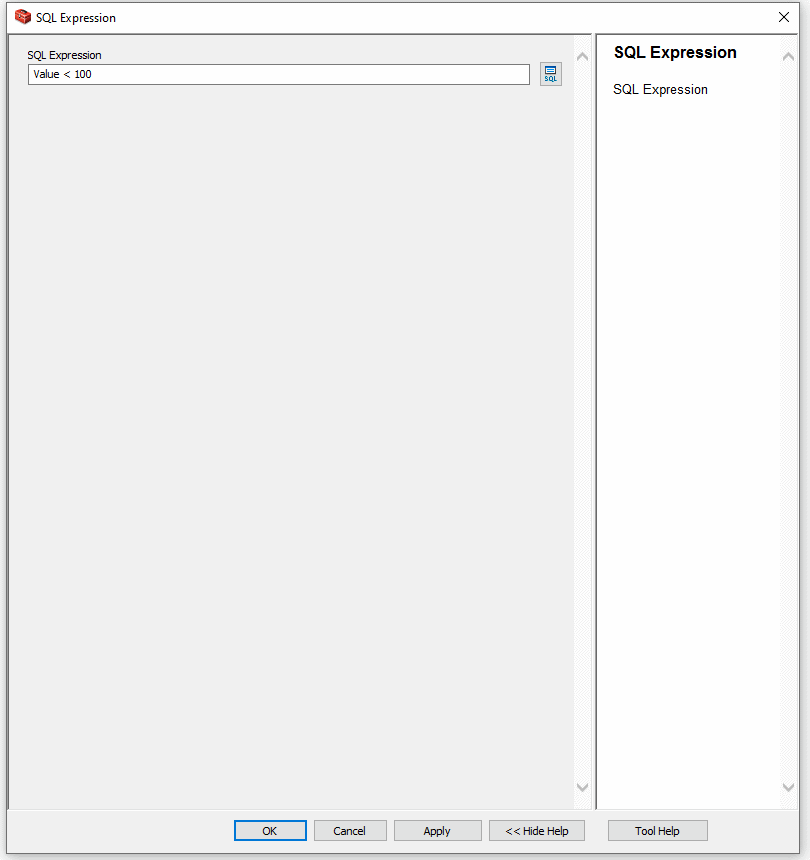
Step 6: Add SQL Expression
The “SetNull” Expression we set in the previous step has larger influence on the Streamline length and how far they reach up into the mountains. Thus we want them to be a modifiable parameter in the model. However, if we simply made the entrie “SetNull” expression a Model Parameter, all the other settings would also appear. To make only the Expression available, we have to do something else. In the Model Builder top row, click “Insert”, “Create Variable”, and then “SQL Expression”. Connect the new object with the “SetNull” tool and enter into the “SQL Expression” what we had before “Value < 100”. Click “OK”. Lastly, right click on the “SQL Expression” and make it a “Model Parameter” so that the little P appears.
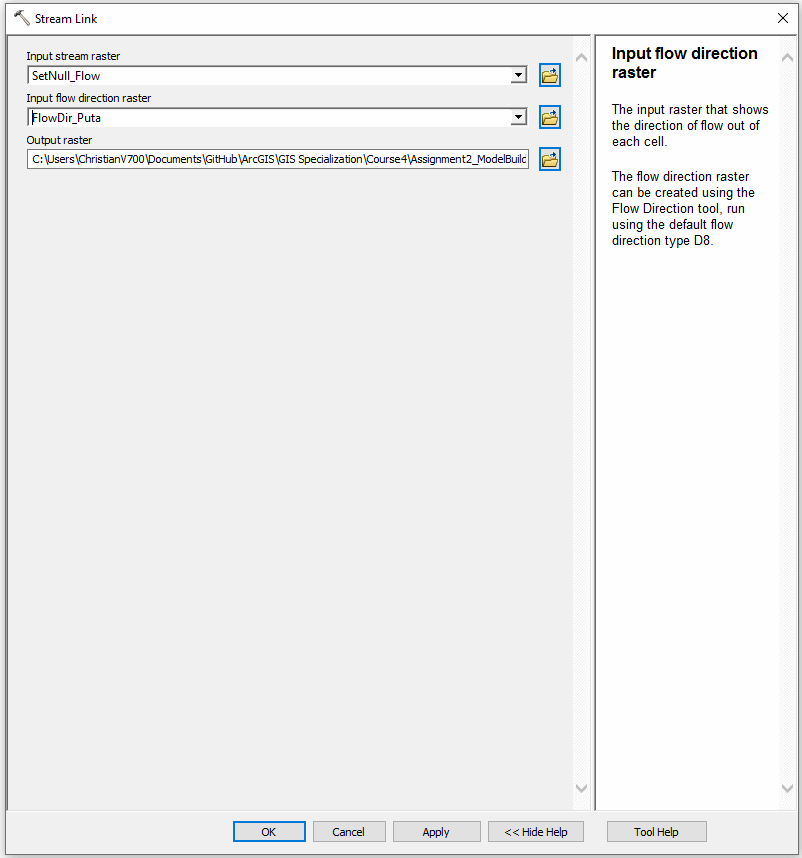
Step 7: Stream Link
In the this step we create a new object that assigns values to stream sections between intersections. Drag the tool named “Stream Links” from the Spatial Analyst, Hydrology toolbox into the Model Builder. Once in the builder we need to double click on the tool object to set two inputs. First, for “Input Stream Raster” select the output of the “SetNull” tool. Second, “Input flow direction raster”, select the “FlowDir” output from the first processing tool in the chain. Two arrows should now point at the “Stream Link” tool.
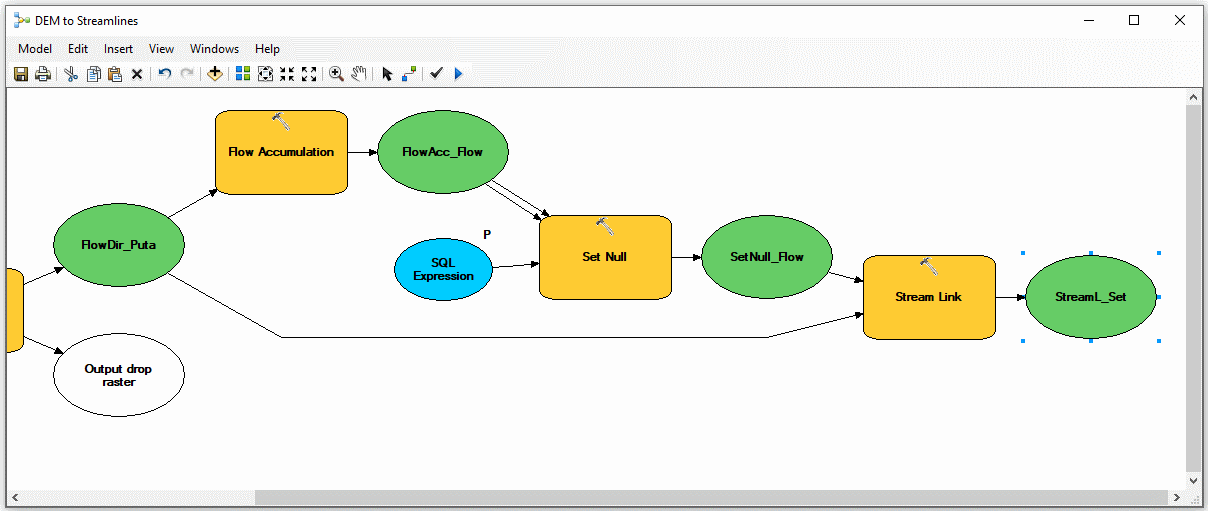
Step 8: Create a Feature
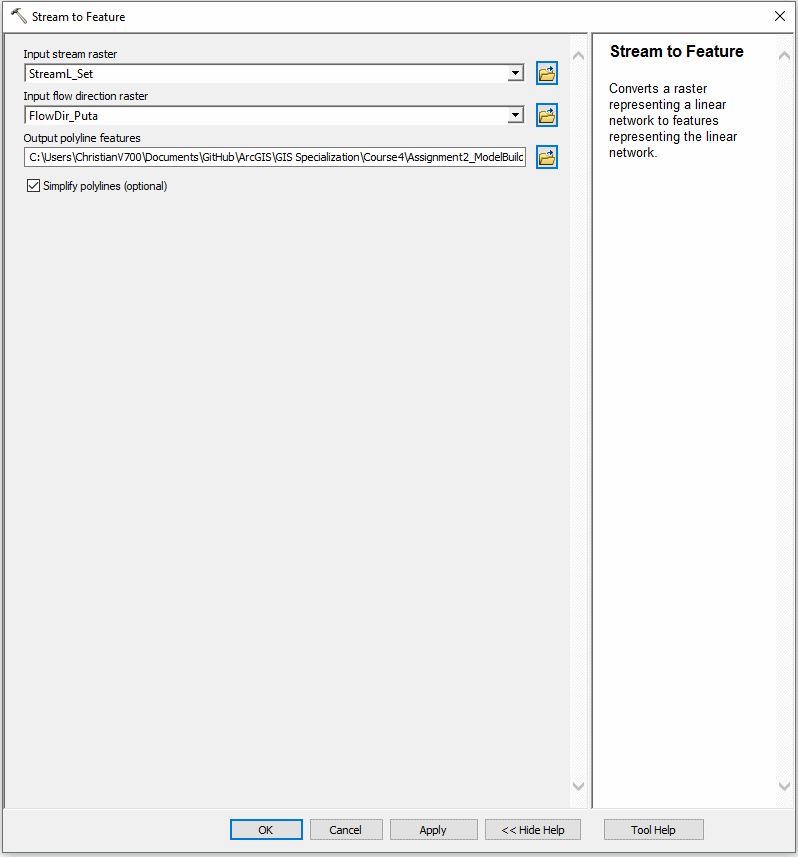
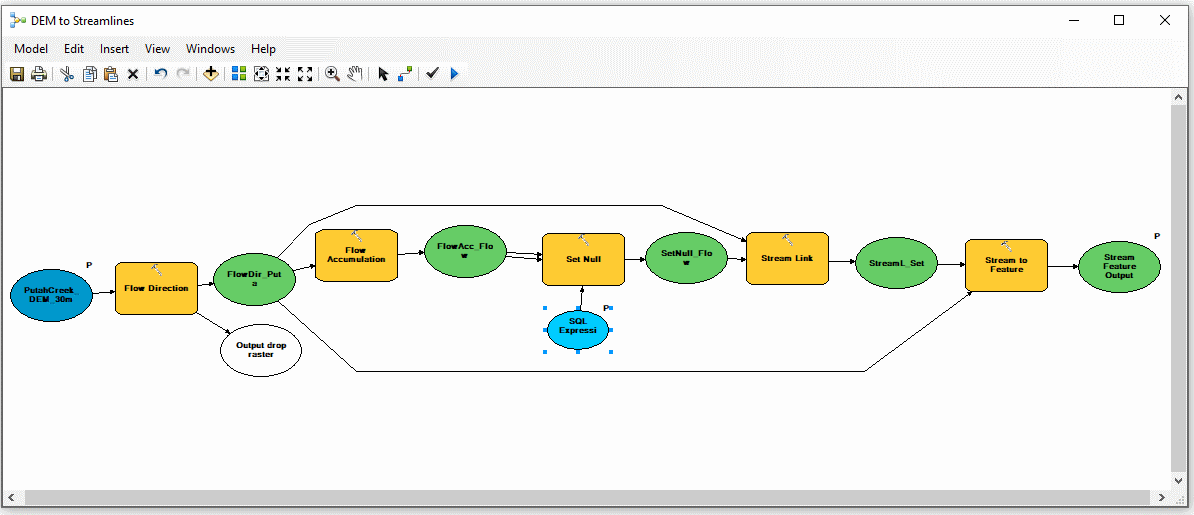
The last processing tool will be the “Streams to Feature” tool, also in the same toolbox as the previous tools. This is going to be a real vector feature. “Stream to Feature” also needs two inputs. First: “Input Stream Raster” is going to be the “Stream Link” output. Second: “Input flow direction raster” is the output from the first tool, same as in the previous step. Click “OK”.
The last output is what we our principal goal was. Rename the output by right cklicking and then “Rename…” to the new name “Stream Feature Output”. Since we want the model to be versatile and determine each time what the name of the last output is going to be, let’s make it a Model Parameter by right clicking and making the tick in the right place. Also it would be interesting to see the result without extra steps, so right click on the output again and make a tick at “Add To Display”. Finally, save the model
Step 9: Finishing Touches and Trial Run
We decide which intermediate outputs we want to store separately in the selected folder or (default) geodatabase. By default, all intermediate outputs are stored and nothing is lost. However, we can make the intermediates temporary by right clicking on the output ovals and selecting “Managed”.
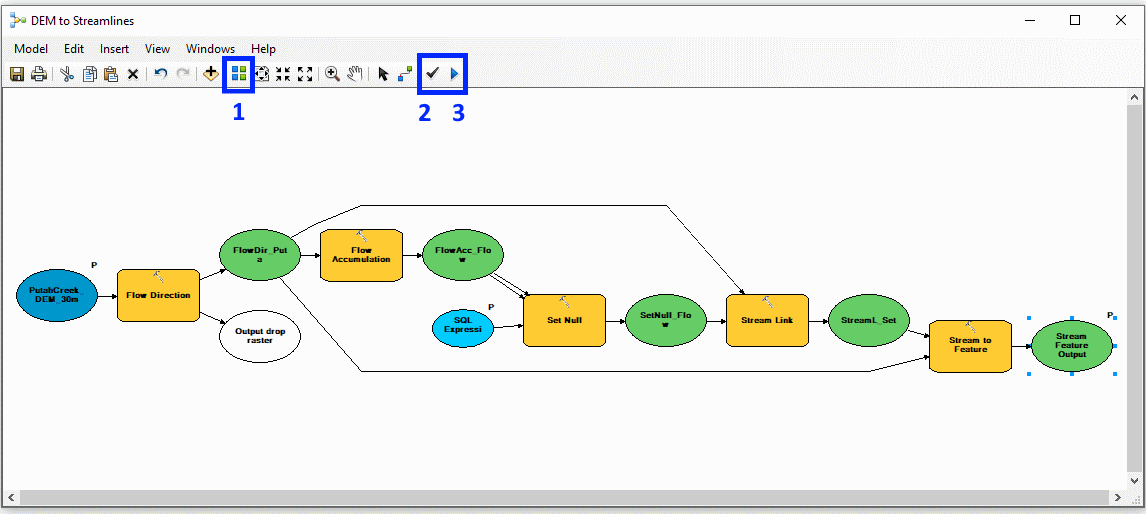
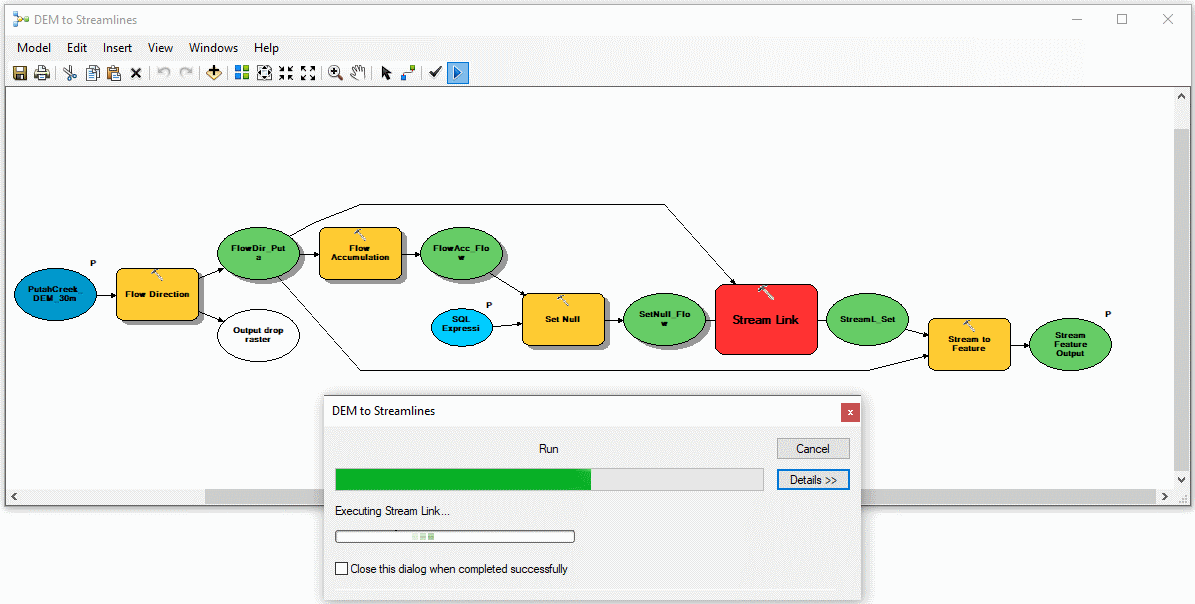
Cleaning up the Model Builder screen will help making the diagram look neat and easy to read. Click in icon row on the icon with the green and blue squares (1). We validate the model by having the Model Builder check if all the inputs, outputs, and options are set and taken care of by clicking on the little tick mark icon (2). Time to test the model. Click the “Play” icon to test-run the model (3). The tool currently processing will fill with red color and after completion it will receive a shadow effect. For testing and diagnosing of parts of the chain you can also select a tool and start the test-run from there. Click the tick icon (2) to reset the model and remove the shadows.
If everything ran fine, delete the DEM path in the first input object on the left, so each time you start the model you do not have the path pre-populated. The coloration will fade except for the SQL statement. Time to save the model and close it.
Step 10: Validation
Time to run a real-world test of the model. Double click on “DEM to Streamlines” in the ArcToolbox, plug in your raster, modify the SQL Expression for accumulation control if you want to, define the output path and name for the streamlines feature, and then go have a coffee while the computer is working.