How big was paleo Lake Bonneville?

Reconstructing the Great Salt Lake’s giant ancestor
Introduction
The Western United States is home to several terminal lakes with no outflow and evaporite deposition such as carbonates and salts (Vennin et al., 2018, Harris et al., 2013). Approximately 15,000 years ago, lakes in the Great Basin of the western United States achieved their maximum late Pleistocene extents. Three of those lake systems stand out in terms of surface area: Lake Lahontan with a surface area of 22,300 km2, Lake Bonneville with a surface area of 51,300 km2, and Lake Missoula with 7,770 km2. These gigantic freshwater bodies, which had surface areas approximately 10 times their reconstructed mean-historical values, have been the subject of intensive scientific research since Russell’s seminal study of Lake Lahontan (Russell, 1885) and Gilbert’s seminal study of Lake Bonneville (Gilbert, 1890). Three main questions have occupied the minds of present-day paleoclimatologists working in these basins: (1) what caused the lakes to grow so large, (2) what was the record of lake-level change in each basin during the last glacial period, and (3) were lake-size changes linked to abrupt changes in the climate of the North Atlantic signaled by Dansgaard-Oeschgerand Heinrich events (Dansgaard, 1993).
It is assumed that the ice shield covering North America during that period placed ground moraine dams on the lakes, which led them to grow in area and depth (Bond, 1993). Melting of the ice sheets “pulled the plug” and rapidly lowered water levels in the basin. Bonneville reached its highstand level at 18.6 ka; it fluctuated near that level until 17.5 ka, at which time it incised its threshold at Red Rock Pass, Idaho, reaching the spillover level named “Red Rock Pass level” at 17.4 ka. Multiple research groups dated paleo-shorelines of Lake Bonneville and corroborated dates of lake levels using sediment cores (e.g., Benson et al. 2011).
This project’s goal is to explore the potential to use publicly Digital Elevation Models (DEMs) to calculate the water volumes in the Lake Bonneville system at different times during the last glacial. Specifically, it is to be answered whether spillover points and outflow locations can be detected using satellite imagery.
Objectives
a. What was the volume and area of glacial paleo-Lake Bonneville during different time intervals and how does it compare to the modern Great Salt Lake? How much of a difference in volume is represent by different shoreline levels?
b. Where were the spillover points/dams for ancestral Lake Bonneville for shoreline levels at various heights?
Data Sources
I will mainly use government-published GIS data for this project, which is a data source most reliable and best-documented.
- First, shapefiles for the maximum extent of Lake Bonneville provided by the The Utah Automated Geographic Reference Center (AGRC). Note that ARGC misuses the term “historic”, since something must have been on human records to be considered historic. They better refer to the “paleo Lake Bonneville” or “ancient Lake Bonneville”.
- Second, a feature containing three historic lake shorelines (1,285 m, 1,283 m, 1,282 m, 1,280 m). These shorelines were observed since the year 1850. The shoreline 1,283 m represents the historic average.
- Third, 1-arc second (30 m) DEMs provided by the USGS The National Map via the Utah ARGC. It has to be assumed that the geomorphology did not change dramatically since the last glacial maximum, which will be an error factoring into the model. Further, locations of dams/spillover points will need to be extracted from the literature and modeled.
Optionally, the USGS also provides 10 m DEMs but at a much larger size of the dataset, which would make processing unwieldy (time and memory).
Methods
The different ages and lake levels since the Late Pleistocene and historic times were gathered from the literature (Benson, 2011) and ARGC. As preparatory step, the ARGC feature containing the historic Great Salt Lake extents gets separated into four polygons.
Then, the relevant DEM tiles are merged to a continuous raster. For each published elevation, the DEMs are clipped to the Bonneville Highstand extent, since the lake never extended beyond this area. This avoids inclusion of low-lying valleys outside the maximum extent.
For each DEM, the elevations above lake level is set to null, which yields the extent and depth information of each lake in time. Following this, the DEMs are converted to a polygon feature, dissolved, and simplified. Using the tool Surface Volume and Zonal Statistics, detailed information about each extent is produced and merged. Based on surface area, volume, and time, fluxes as a time series are calculated on spreadsheet.
Results
Objective A: Volume and Area
Literature review yields eight significant lake levels, four recognized from chronologically dated paleo shorelines in the Late Pleistocene, and four historic levels recorded by various types of technology available at the time (Figure 1). Lake volumes and surface area changed significantly during the time Late Pleistocene (Table 1). The water levels at Great Salt Lake were gauged since 1850 and on average sat at 1,283 m, with a maximum water depth of 6 m. During the Bonneville Highstand, the lake was up to 275 m deep.
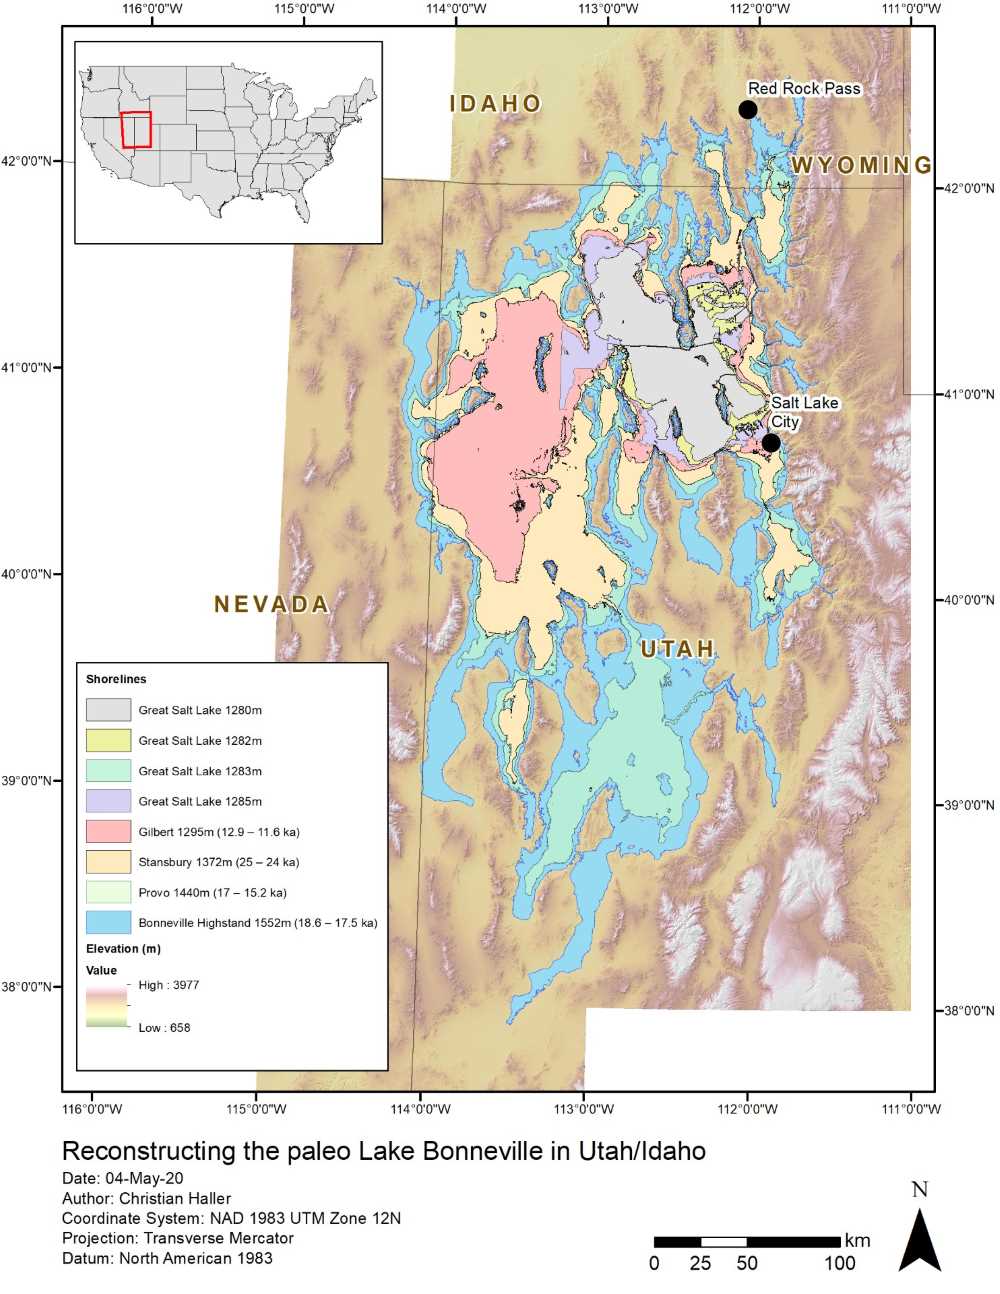
Figure 1 Extent of paleo lake levels recorded as shorelines and historic levels using gauges since 1850 (see Table 1).
Table 1 Processing results
| Name (elevation) | Time (ka) | Surface (km2) | Volume (km3) | Max. Depth (m) |
|---|---|---|---|---|
| Stansbury Oscillation (1,372 m) | 25 – 24 | 25,824.7 | 1,798.7 | 95 |
| Bonneville Highstand (1,552 m) | 18.6 – 17.5 | 49,030.4 | 8,601.6 | 275 |
| Provo (1,440 m) | 17 – 15.2 | 35,031.8 | 3,892.8 | 163 |
| Gilbert (1,295 m) | 12.9 – 11.6 | 15,216.1 | 143.9 | 18 |
| Great Salt Lake (1,285 m) | historic | 6,471.0 | 23.7 | 8 |
| Great Salt Lake (1,283 m) hist. avg. | historic | 5,154.8 | 11.5 | 6 |
| Great Salt Lake (1,282 m) | historic | 4,758.7 | 6.7 | 5 |
| Great Salt Lake (1,280 m) | historic | 1,445.6 | 0.9 | 3 |
Using the timing and the water volume data, the net water flux in and out of the lake was calculated (Figure 2). Major net influx occurred between 24 ka (Stansbury Oscillation) and 18.6 ka (Bonneville Highstand). The transitional periods after 17.5 ka are marked by outflow, most notably the flood event spilling over at Red Rock Pass, Idaho. The water level was stable at the Provo level between 17 and 15.2 ka, after which another rapid volume loss occurred. Coming to a halt at the level of the Gilbert shoreline (12.9 ka) relatively little volume loss occurred till modern day.
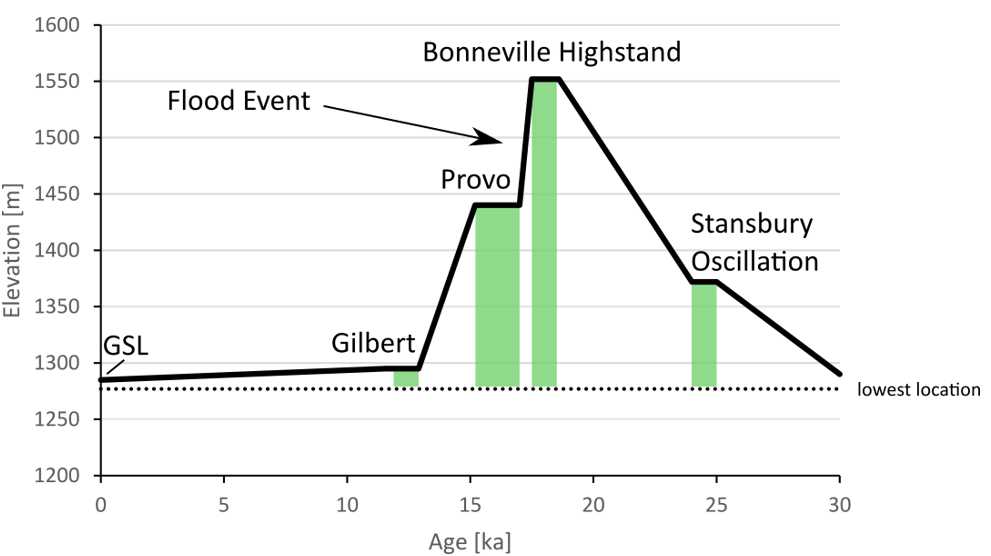
Figure 2 Water level above sea level.
Table 2 Flow rate comparison with similar modern waterfalls (Wikipedia, 2020)
| km3/a | m3/a | m3/s | |
|---|---|---|---|
| Niagara Falls | 75.91 | 75,907,152,000 | 2,407 |
| Bonneville Highstand Flood Event (0.1 kyrs) | 47.09 | 47,088,000,000 | 1,493 |
| Great Falls (Virginia, USA) | 14.95 | 14,948,064,000 | 474 |
| Bonneville Highstand Flood Event (0.5 kyrs) | 9.42 | 9,417,600,000 | 299 |
| Murchison Falls (Uganda) | 9.46 | 9,460,800,000 | 300 |
| Alexandra Falls (NW Territories, Canada) | 8.89 | 8,893,152,000 | 282 |
In summary, the lake changed in size massively and was significantly larger in surface area, volume, and water depth. During the Bonneville Highstand between 18.6 and 17.5 ka, the lake contained ~750 times the volume it does today and was at its deepest point ~45 times as deep compared to the historic average. During the great flood event following the Bonneville Highstand, 224 mm (0.224 m) were drained on average per year for a total of 0.5 kyrs (500 years) from the lake (Figure 3). This flow rate is a large number when compared for example with the current sea level rise of 3.3 mm per year (NASA, 2020). Proof of the flood event are deposited sediments north of Red Rock Pass draping the valleys and the Snake River Plain (Malde, 1968). Assuming that the majority of the water drained evenly and not evaporate this can be put in perspective by comparing with modern waterfalls (Table 2). However, some authors believe that the flood was much more intense and the lake reached Red Rock Pass-level within 0.1 kyrs (Oviatt, 1992), which would make the flood similar in scale to the Niagara Falls at the US/Canada border.
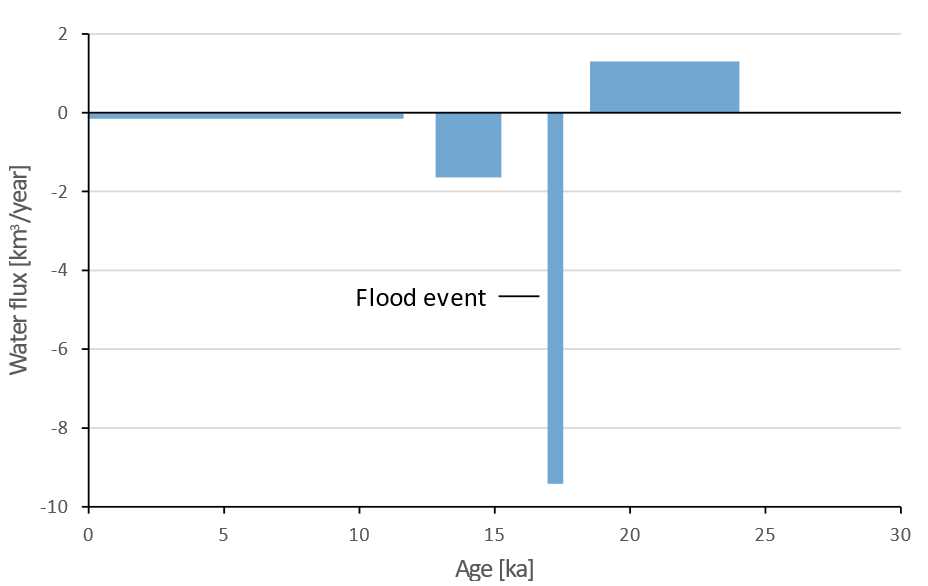
Figure 3 Net water flux between stable lake levels.
Objective B: Spillover points/dams
Bonneville reached its highstand level at 18.6 ka; it fluctuated near that level until 17.5 ka, at which time it incised its threshold. The location of the spillover point at Red Rock Pass, Idaho is apparent in the elevation data as a meandering incision in the glacial till sediments (Figure 4). Incision continued until the bedrock formation at Red Rock Pass was met. Red Rock Pass was likely the only spillover point of the lake as constrained by δ18O from sediment cores (Benson, 2011). Later decrease in water volume came about through a shift towards warmer temperatures and higher evaporation in the post glacial times.
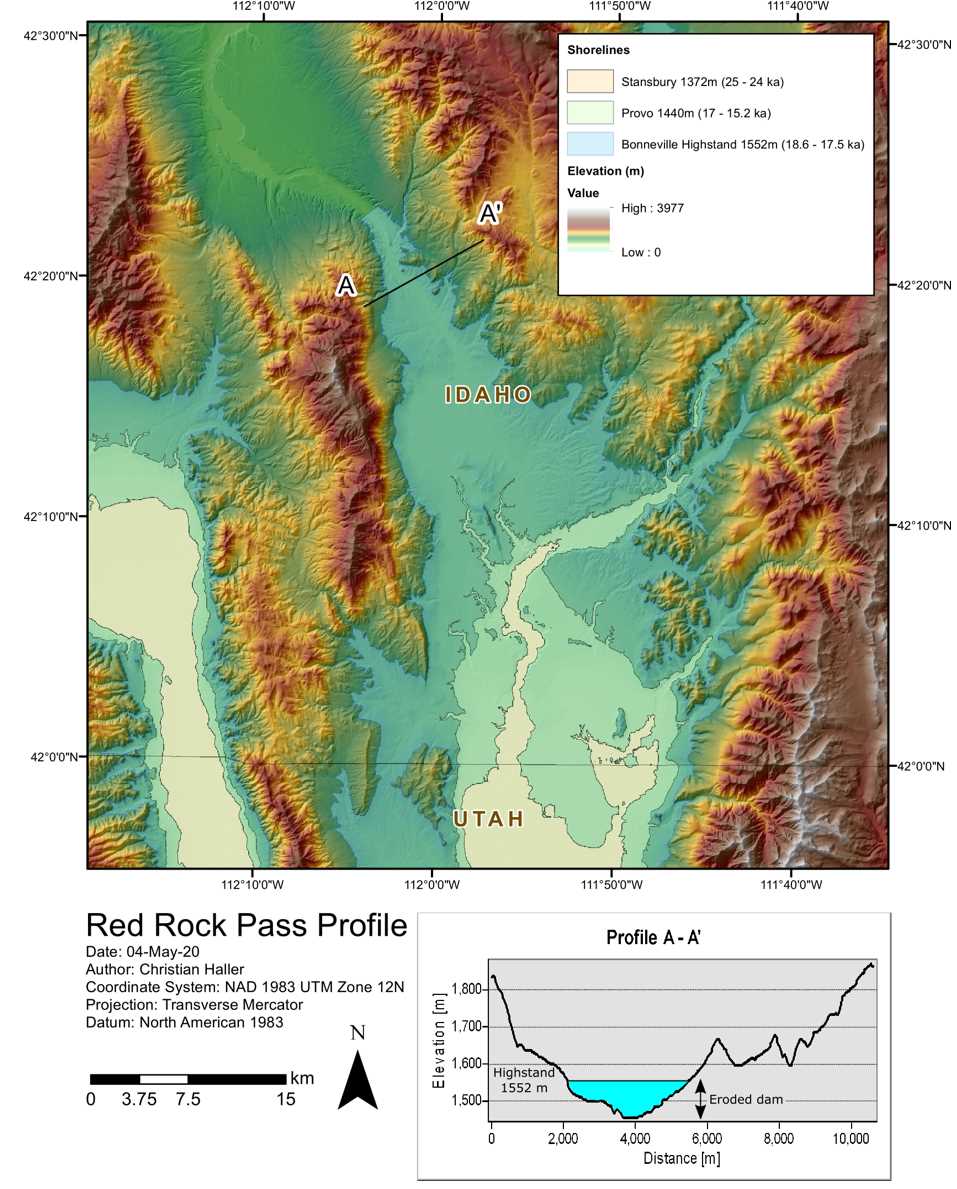
Figure 4 The spillover point at Red Rock Pass. After the erosion of the sediment dam, which caused the Flood Event at 17.5 ka, the lake receded to the Provo level.
Discussion
The results yielded detailed information on the Great Salt Lake and its ancient predecessors: The Great Salt Lake used to be significantly larger and saw periods of water-level rise and fall. With an influx of 1.26 km3/year and lake level rise of 180 m between 24 and 18.6 ka this transitional period was the only time recorded with net growth of the lake surface area. The lake level reached a maximum termed the “Bonneville Highstand” between 18.6 and 17.5 ka. The loss of 4,708.80 km3 between 17.5 and 17 ka is referred to as the Flood Event. Spilling through the Red Rock Pass, northeast of the lake in Idaho, the water level dropped 112 m at flowed at rates resembling modern waterfalls. Conservative estimates (slow drain over 0.5 kyrs) suggest a waterfall the size of the Murchison Falls (Nile, Uganda). Other estimates suggest a faster drainage in 0.1 kyrs, which means an outflow event similar to the size of the Niagara Falls (USA/Canada border). Between 17 and 15.2 ka the lake resided at the Provo shoreline, which is just below the bedrock level of the Red Rock Pass. The fall from the Provo level to the Gilbert level was a 145 m drop as a closed system. Likely causes are climate change coming out of the glacial such as warmer temperatures and melting glaciers. Decreased precipitation and increased evaporation resulted in a net loss of lake volume. From the Gilbert shoreline it was a 10 m drop to the historic Great Salt Lake levels. Water volume decreased slowly to a tenth. The historic Great Salt Lake had significant changes in water volume from 0.9 km3 (1,280 m elevation) to 23.7 km3 (1,285 m elevation). However, it is currently assumed that not climate exclusively influences the water level of the Great Salt Lake. Current studies making use of hydrological accounting to calculate the water balance of the basin suggest that human consumption such as by consuming streamwater before it replenishes the lake may be a major influence (Wurtsbaugh, 2017).
Limitations of the dataset
The USGS National Map 1-arc-second DEM is continuous and well updated. However, especially within the Great Salt Lake area the data seem inconsistent and not faithfully representing the bathymetry. This is visible through the rectangular blocks representing large parts of the bathymetry. This may be attributed to the difficulty for obtaining bathymetry data by boat from the in relatively shallow lake. The Utah Geological Survey and Utah Division of Forestry, Fire and State Land published a newer LIDAR dataset in 2016 (Link) covering the lake shores in 0.5 to 1 m resolution. However, this dataset spares out the submerged parts of the lake. This means that the volumes and depths for the historic lake extents may not be as accurate. Since the historic part is only a fraction of the ancient extents, this skew may be less significant for the reconstructions of these parameters.
References
- Benson, L. L., Lund, S. P., Smoot, J. P., Rhode, D. E., Spencer, R. J., Verosub, K. L., Louderback, L. A., Johnson, C. A., Rye, R. O., Negrini, R. M. (2011). The rise and fall of Lake Bonneville between 45 and 10.5 ka. Quaternary International, 235, 57-69. DOI: 10.1016/j.quaint.2010.12.014
- Bond, G., Broecker, W., Johnsen, S., McManus, J., Labeyrie, L., Jouzel, J., Bonani, G. (1993). Correlations between climate records from North Atlantic sediments and Greenland ice. Nature, 365, 143-147. DOI: 10.1038/365143a0
- Dansgaard, W., Johnsen, S., Clausen, H.B., Dahl-Jensen, E., Gudnestrup, N.S., Hammer, C.U., Hvidberg, C.S., Steffensen, J.P., Sveinbjornsdottir, A.E., Jouzel, J., Bond, G. (1993). Evidence for general instability of past climate from a 250-kyrice-core record. Nature, 364, 218-220. DOI: 10.1038/364218a0
- Gilbert, G. K. (1890). Lake Bonneville. U.S. Geological Survey Monograph. DOI: 10.3133/m1
- Harris, P. M., Ellis, J., Purkis, S. J. (2013). Assessing the extent of carbonate deposition in early rift settings. AAPG Bulletin, 97, 27-60. DOI: 10.1306/06121212003
- Malde, H. E. (1968). The Catastrophic Late Pleistocene Bonneville Flood in the Snake River Plain. U.S. Geological Survey Professional Paper, 52. DOI: 10.3133/pp596
- NASA. (2020, April). Global Climate Change - Vital Signs of the Planet. Retrieved from https://climate.nasa.gov/vital-signs/sea-level/
- Oviatt, C. C., Currey, D. R., Sack, D. (1992). Radiocarbon chronology of Lake Bonneville, Eastern Great Basin, USA. Palaeogeography, Palaeoclimatology, Palaeoecology, 99, 225-241. DOI: 10.1016/0031-0182(92)90017-Y
- Russell, I. (1885). Geological History of Lake Lahontan, A Quaternary Lake of Northwestern Nevada. U.S. Geological Survey Monograph. DOI: 10.3133/m11
- Vennin, E., Bouton, A., Bourillot, R., Pace, A., Roche, A., Brayard, A., Thomazo, C., Virgone, A., Gaucher, E. C., Desaubliaux, G., Visscher, P. T. (2018) The lacustrine microbial carbonate factory of the successive Lake Bonneville and Great Salt Lake, Utah, USA. Sedimentology, 66, 165-204. DOI: 10.1111/sed.12499
- Wikipedia. (2020, 4 28). List of Waterfalls by Flow Rate. Retrieved from https://en.wikipedia.org/wiki/List_of_waterfalls_by_flow_rate
Additional Media
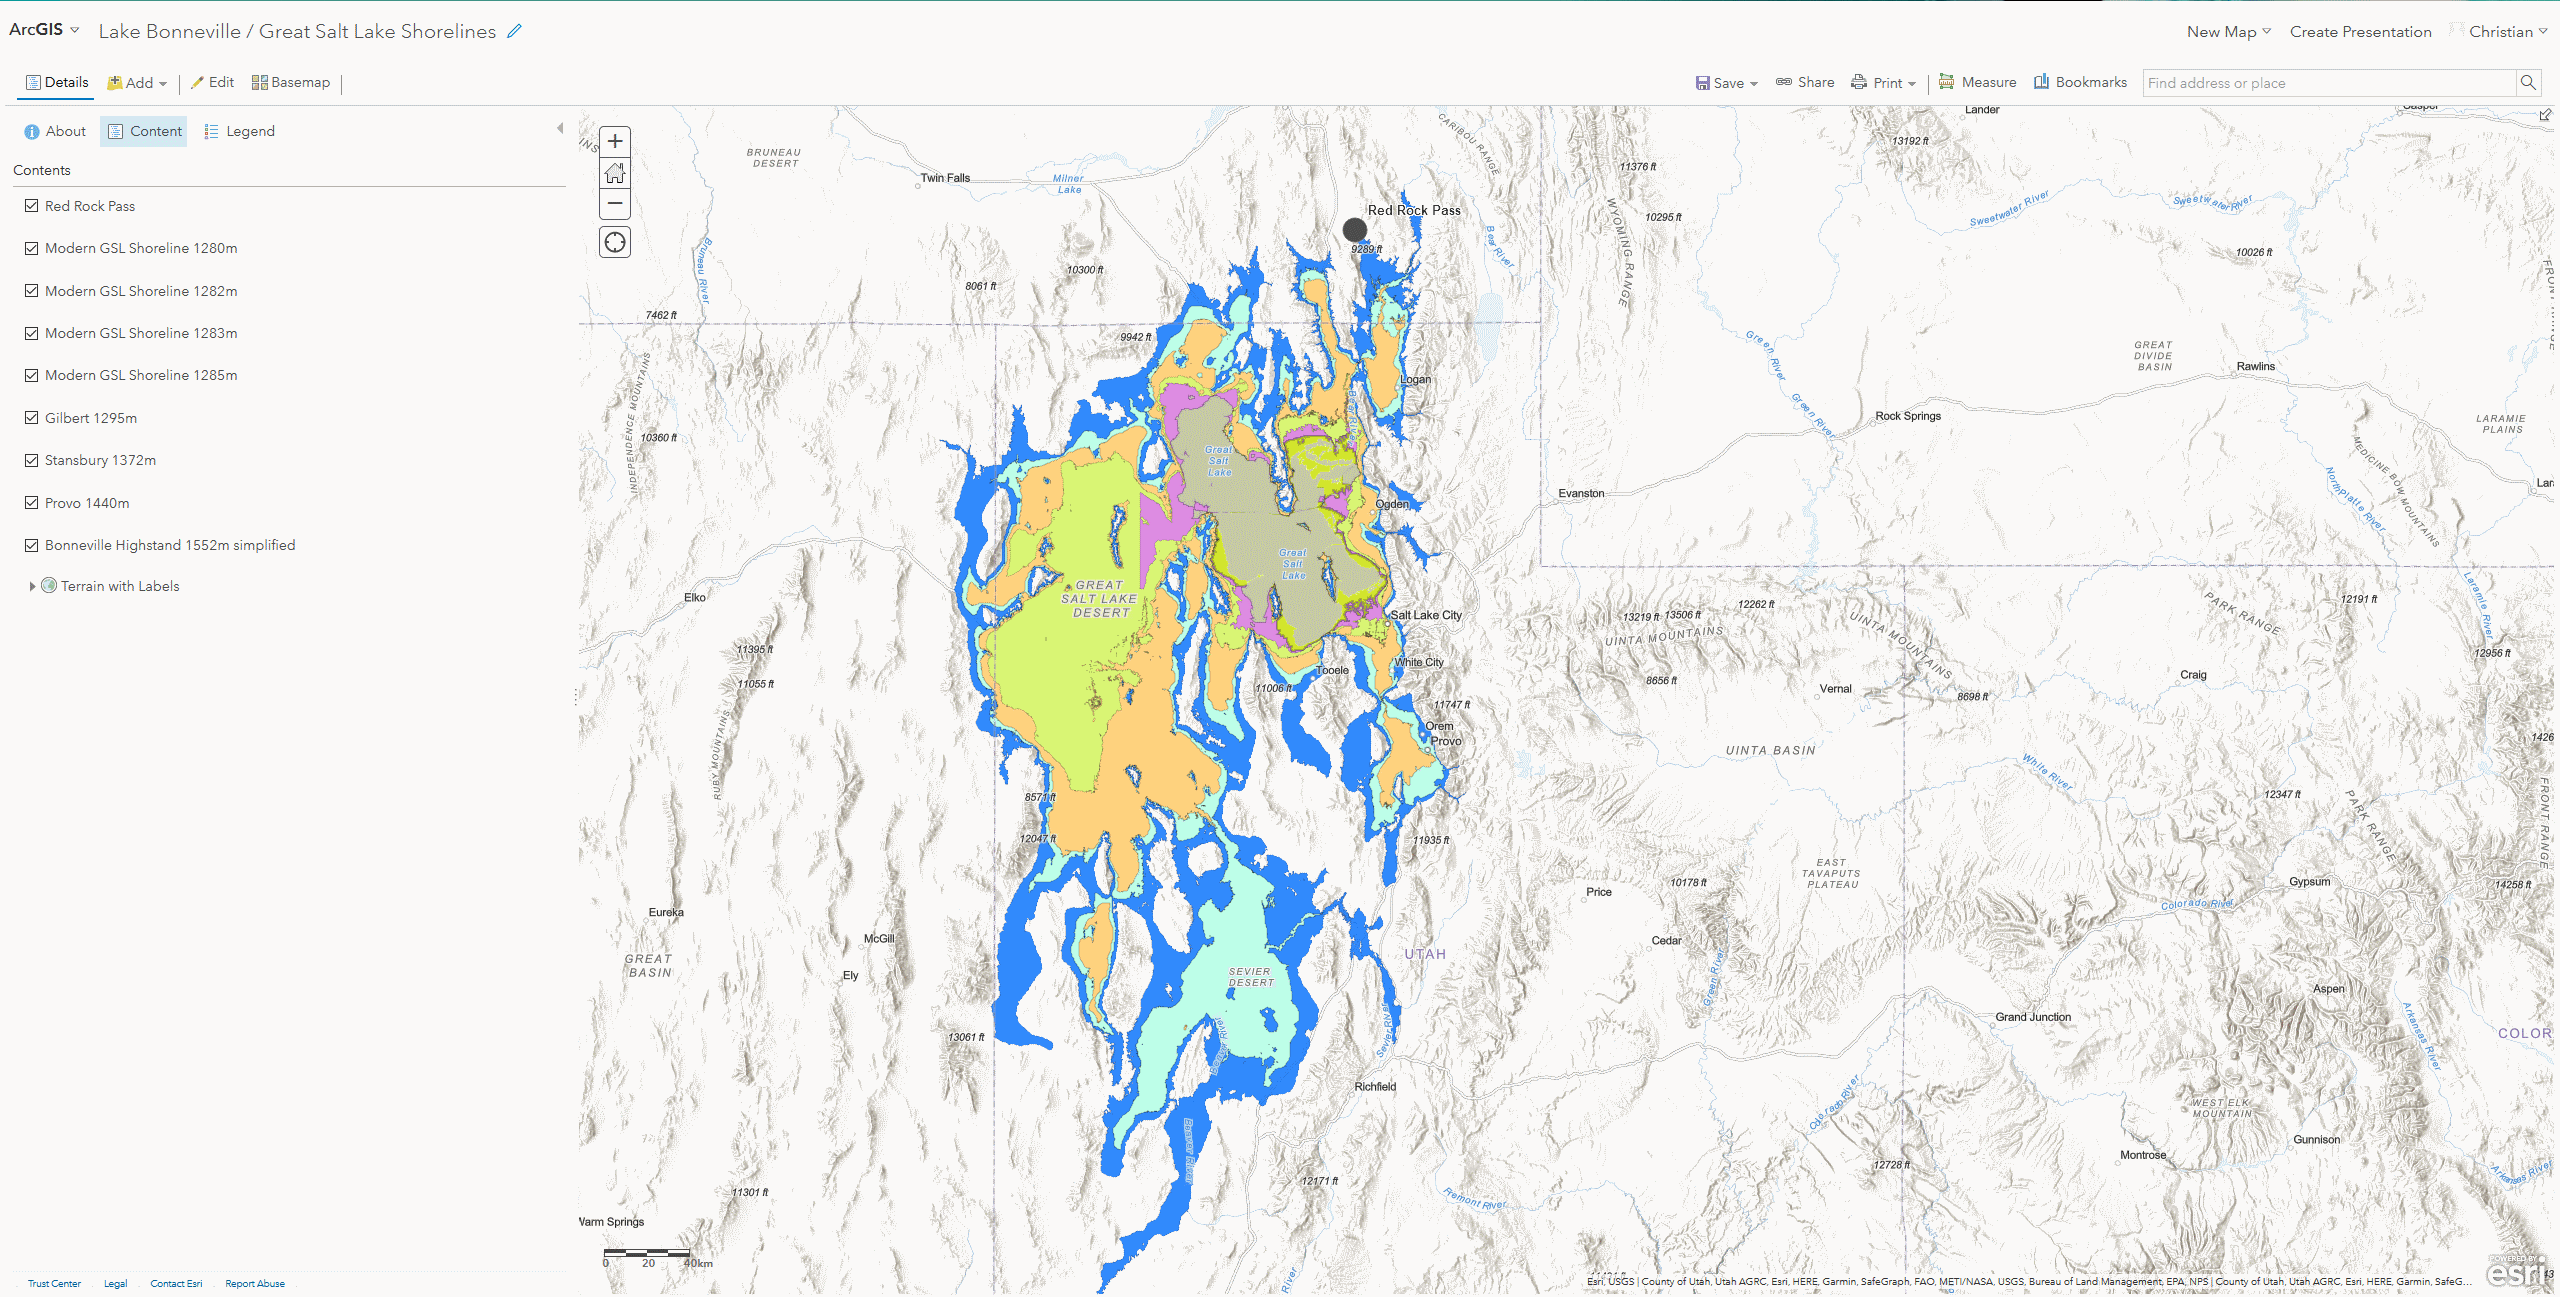
Interactive Map on ArcGIS Online
Click “Open in Map Viewer”