Seismic Interpretation ... the Art and Science
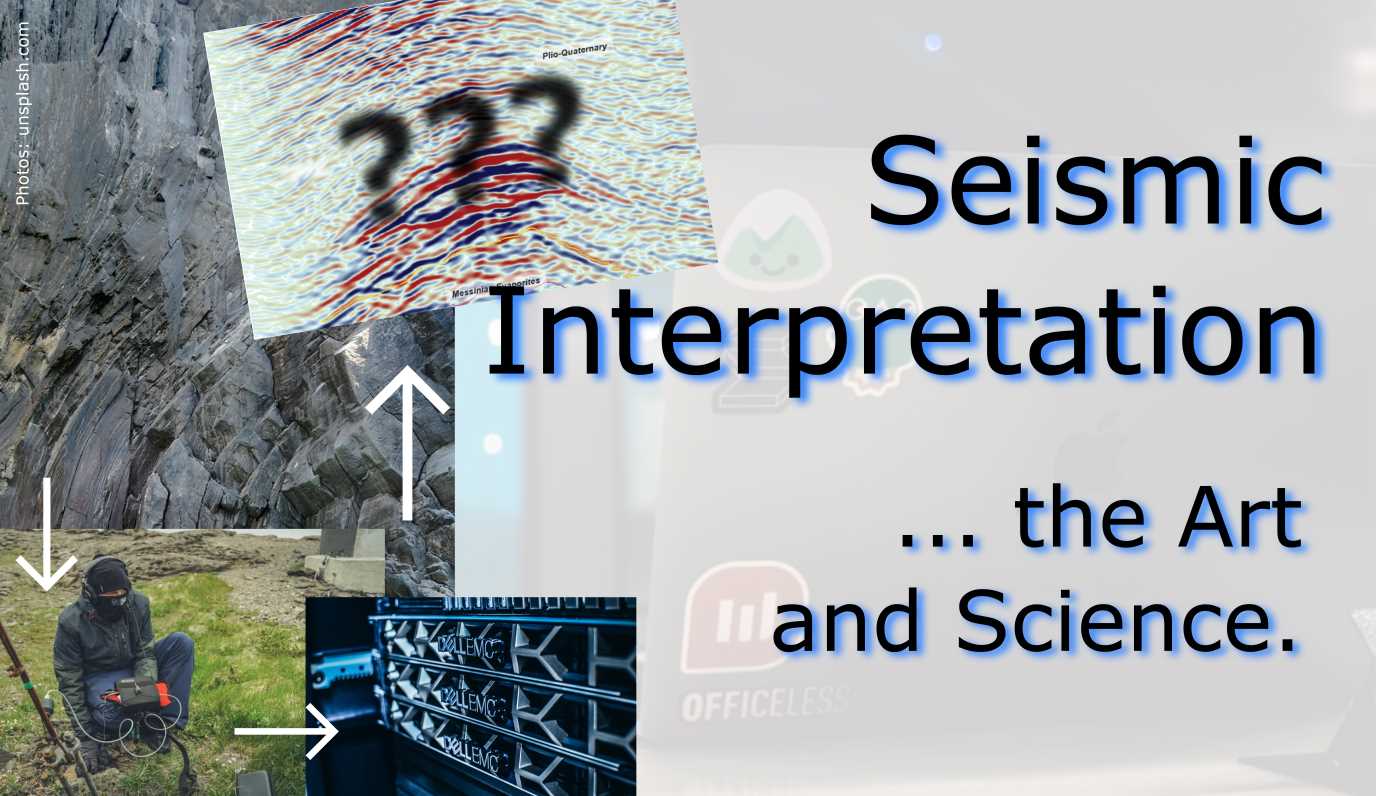
The final step in the work with seismic data is seismic interpretation.
Introduction
A Paleontologist, a Geologist, and a Geophysicist are interviewing for a job.
First, the Paleontologist is asked in to the Hiring Manager's office and the Paleontologist is shown a piece of paper with some wrtiting.
The Hiring Manager asks: "What do you see?" The Paleontologist quips "The number 4"

The Hiring Manager is continues the interview and then asks the Geologist into his office.
The Hiring Manager asks: "What do you see?" The Geologist looks at the paper and after short deliberation replies: "4.0".

Finally, the Hiring Manager beckons the Geophysicist into the office and hands him the paper.
He asks: "Geophysicist, what do you see?". The Geophysicist looks at the sheet for a long time, turns it upside down, thinks.
The Geophysicist leans forward and whispers: "What do you want it to be?"
Flat Spots
The seismic data acquisition andc analysis worlfow goes through many steps as you can see (abbreviated) in the cover picture. The final step is seismic interpretation. In the scientific field called geophysics, interpretation sounds highly subjective. Very different from the usual statistics, ray and wave phenomena that can be calculated in detail.
How can that be right?
I would enjoy to say that interpretation is straight forward and seismic data reveals the perfect image of the subsurface for making business decisions. But it is not. Any way we manipulate seismic data has one single purpose: revert the filtering effect, distortion, and noise of the subsurface on our data to make the picture clearer. Of course, each step is based on assumptions. Imagining all the steps geophysicists undertake to improve up the image quality, it is sometimes amazing you can make any use of seismic data at all.
After all the pre-processing the geophysicist is left with something like in the image below:
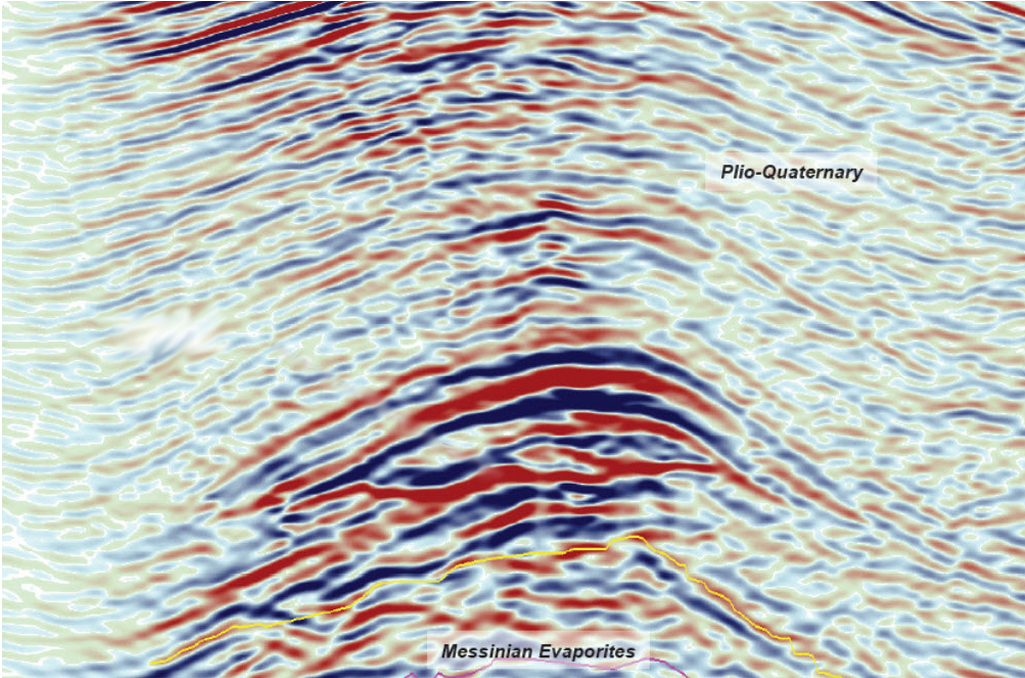
Joshua Doubek / pickthis.io
This seismic image is easy on the eyes: low noise and great contrast. You can even see some hydrocarbons! At least if the interpreter knows what they are looking at.
The upper depositional unit is made up of Pliocene-age sediments. They are layered like pan cakes, which usually indicates some kind of marine or lacustrine deposition history.
You see some strong contrasts in an upwards-buckling structure. The rounded structure consists of evaporites (e.g., salt, gypsum, anhydrite). An upward-buckling structure like that is called an anticline and is the most old-fashioned and easiest means of how the hydrocarbon industry (oil and gas) obtains their product. The hydrocarbons are lower density than the rock and water inside the rock formation so that they rise up. In such anticline structures hydrocarbons get trapped below a sealing (non-pearmeable) rock formation and build a reservoir volume.
Within this anticline structure you see something that cannot form syn-depositionally: There are two lines crossing at a pointy angle. The convex anticline crosses an almost straight (horizontal) line. This indicates that there has to be something else causing this peculiar shpe. These so-called flat spots can be a direct indicator for hydrocarbons trapped. The Flat Spot is a special Direct Hydrocarbon Indicator (DHI). The gas and oil in the rock posess a very much different accoustic impedance for our seismic signal than the regular rock.
Now the really interesting part of the story is, that you (the reader) were very probably able to follow this explanation of the flat spot. But there is a high probability that you and I were not looking at exactly the same flat structure. Seismic interpreters working with a single seismic image will interpret it in different ways. The following image from https://pickthis.io, a social image interpretation web-app, is a stacked graph of ~40 interpreters’s opinions (more overlap = hotter). Click me!
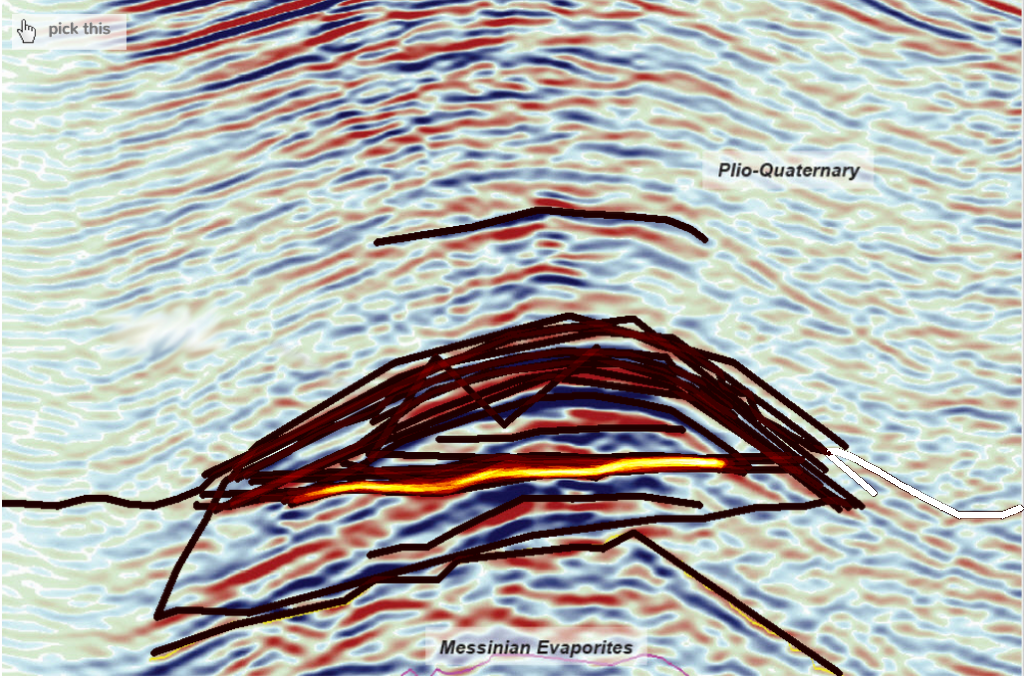
Joshua Doubek / pickthis.io
Science can explain these patterns well, but finding them is still highly subjective. You can see that the heatmap shows many picks along the flat spot described. This is especially interesting as I posed the challenge to pick the “hydrocarbon indication” instead of directly giving out the challenge “find the flat spot”, giving us many more interpretations. This starts becoming a problem when companies require hard volume numbers on how much hydrocarbons are trapped in the structure (or none at all??). These volumes go into larger risk calculations if the company wants to invest in drilling the structure or not. The interpretation is a make-or-break situation and such requires experience and at best multiple sets of eyes.
For building up your interpretation experience, I encourage you to sign up with https://pickthis.io and take the challenge for yourself. Note: Only after submitting your interpretation you can see the others’. Be relieved, there is no wrong interpretation, just look at it and get going. If you know your way in geophysical interpretation already, then this is a perfect training opportunity without wagering your company’s exploration budget.
Some Examples from pickthis.io
Low resolution extensional faulting
Task: Pick the location and extent of the largest normal fault.
Description: Seismic section through Penobscot 3D seismic volume.
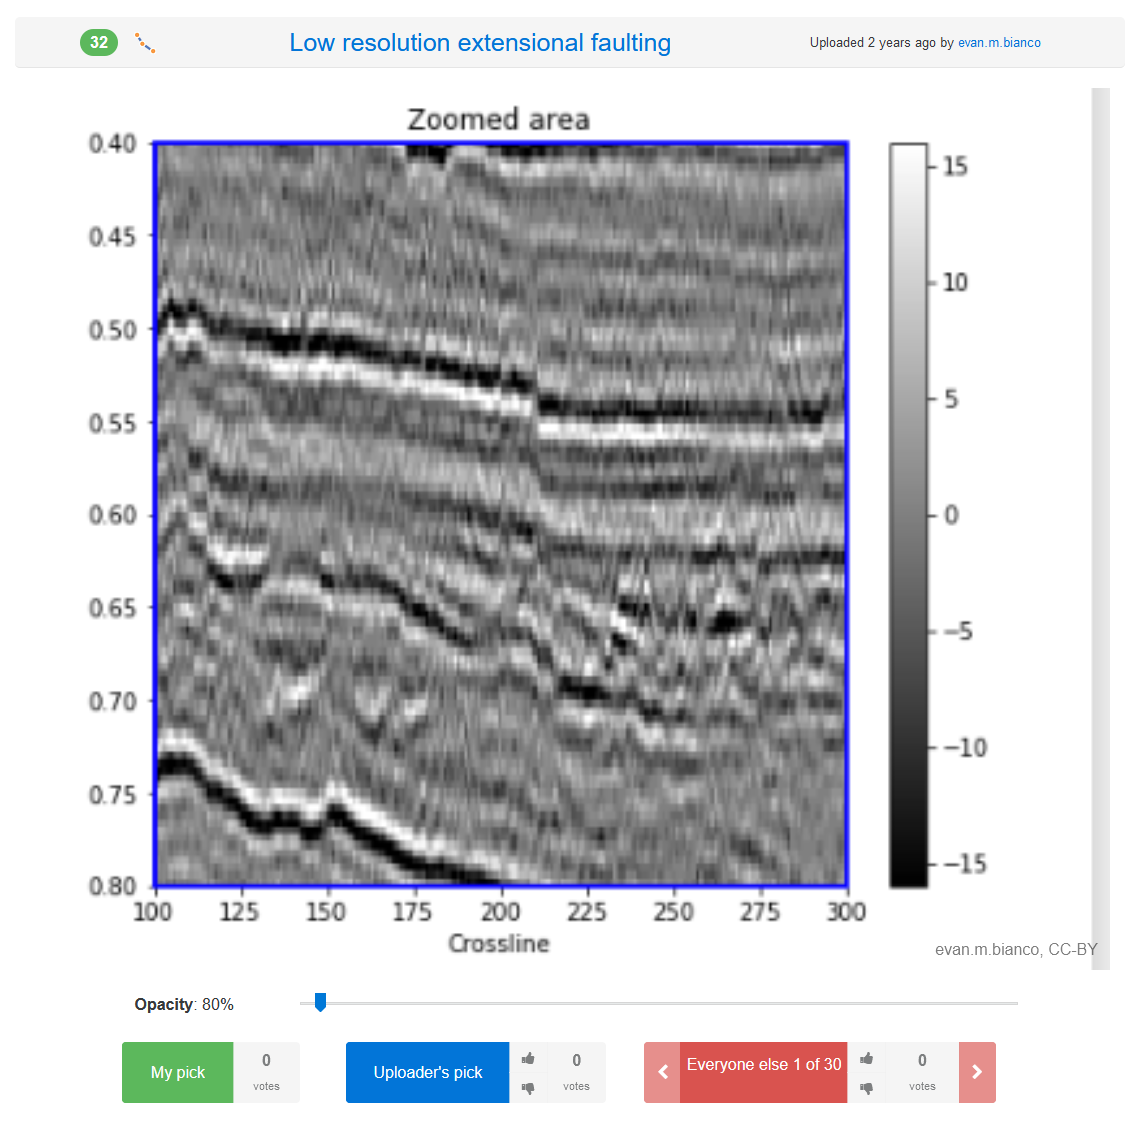
Evan M. Bianco / pickthis.io
Click me!
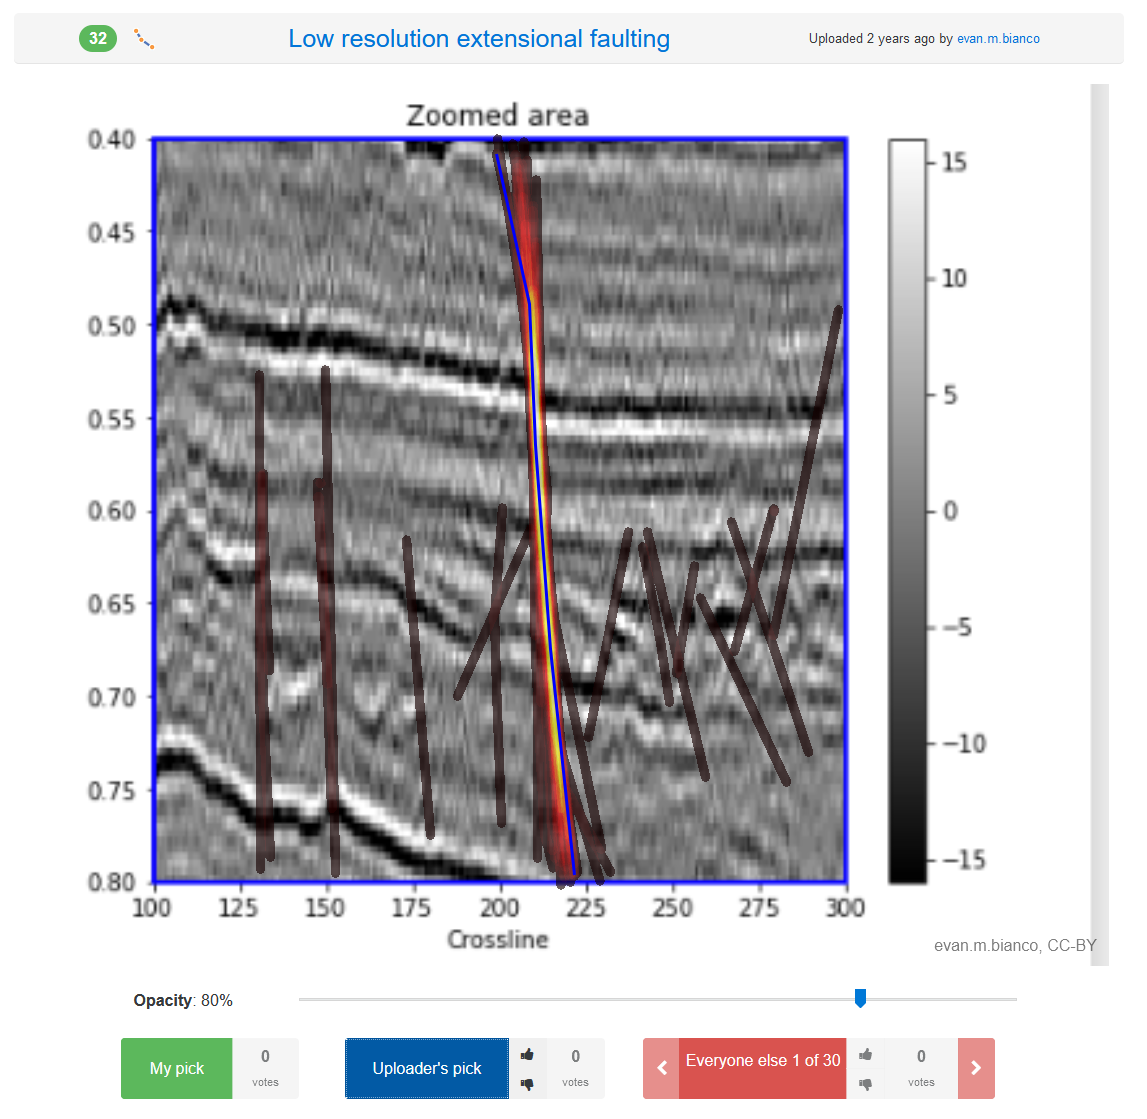
Evan M. Bianco / pickthis.io
Pick the fault
Task: Pick the fault and analyze the structure.
Description: Pick the fault along the cross section.
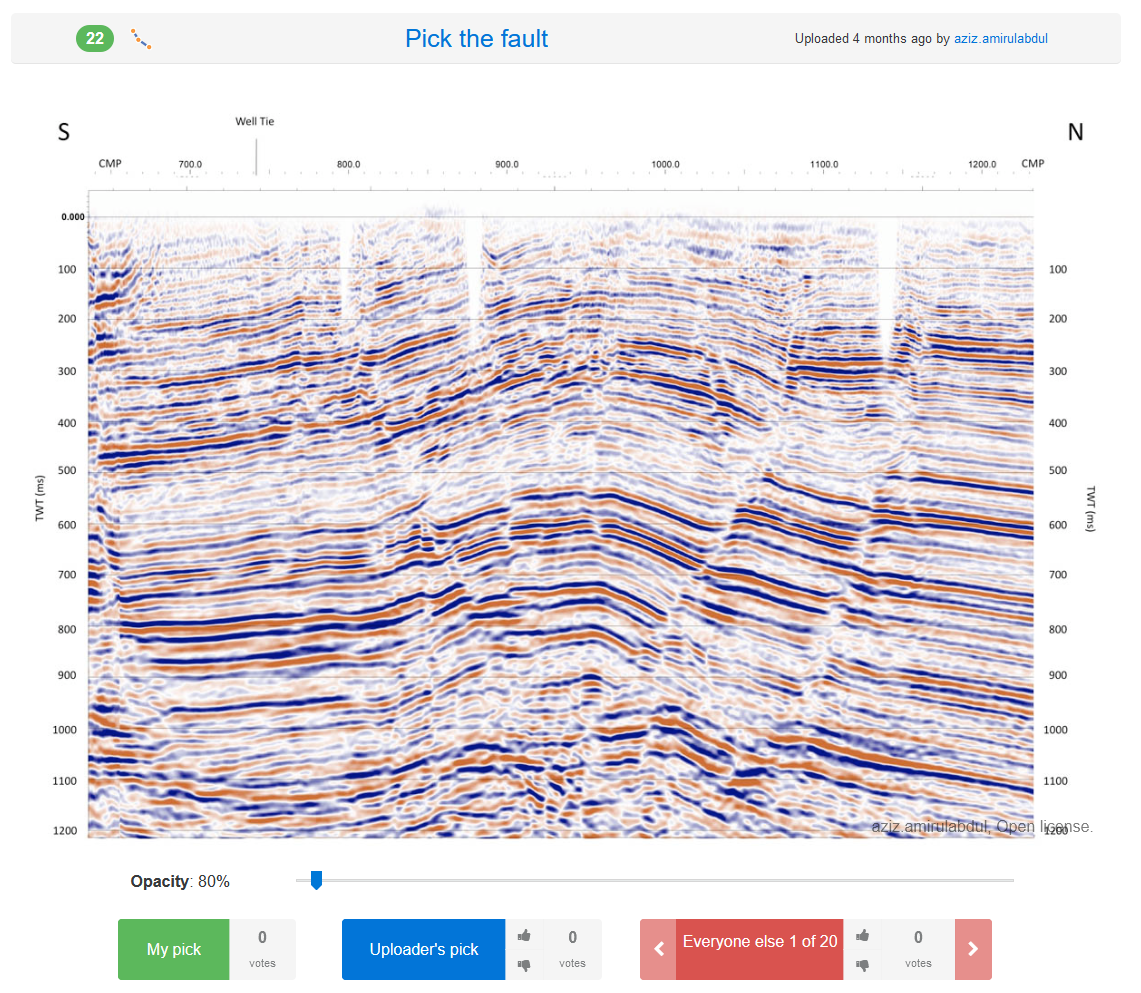
Aziz Amirul Abdul / pickthis.io
Click me!
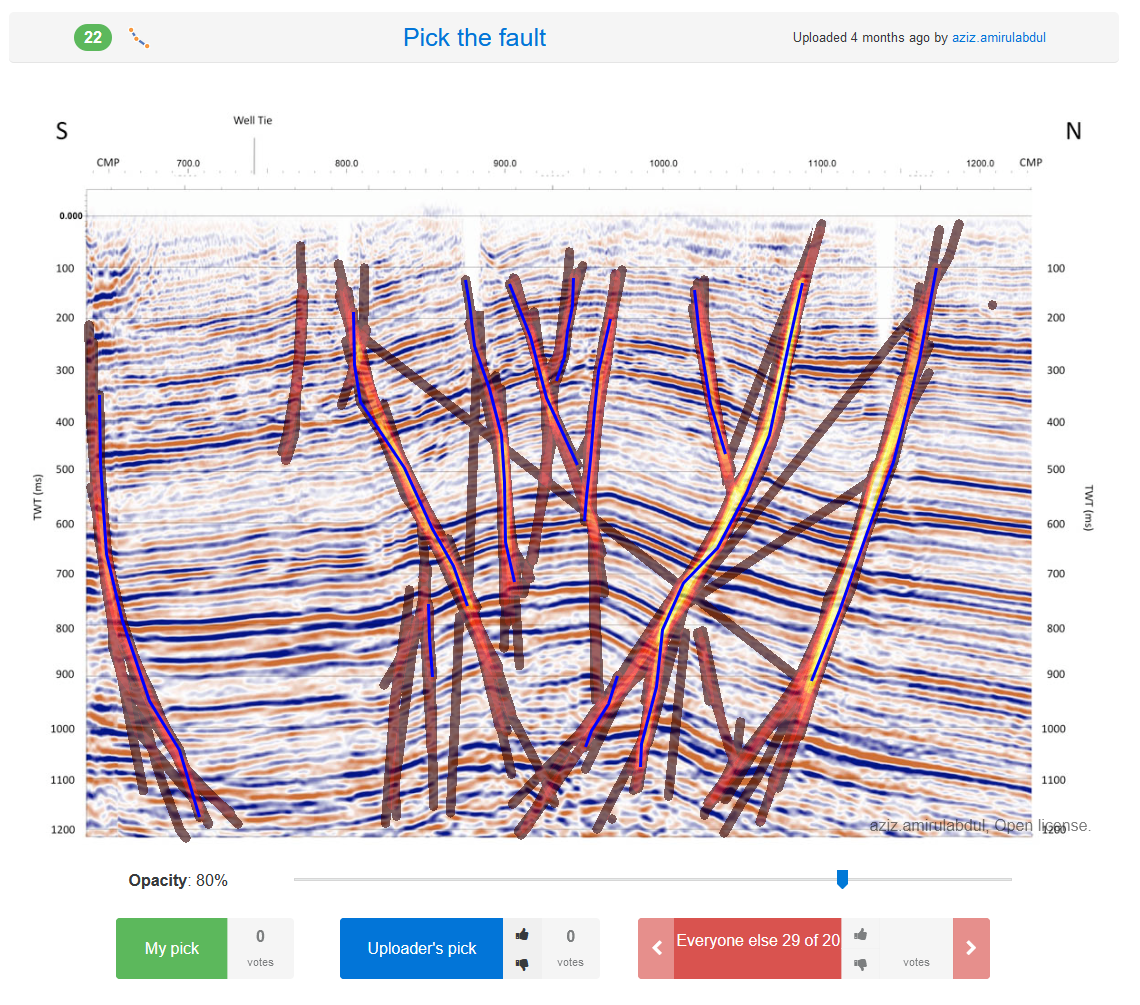
Aziz Amirul Abdul / pickthis.io
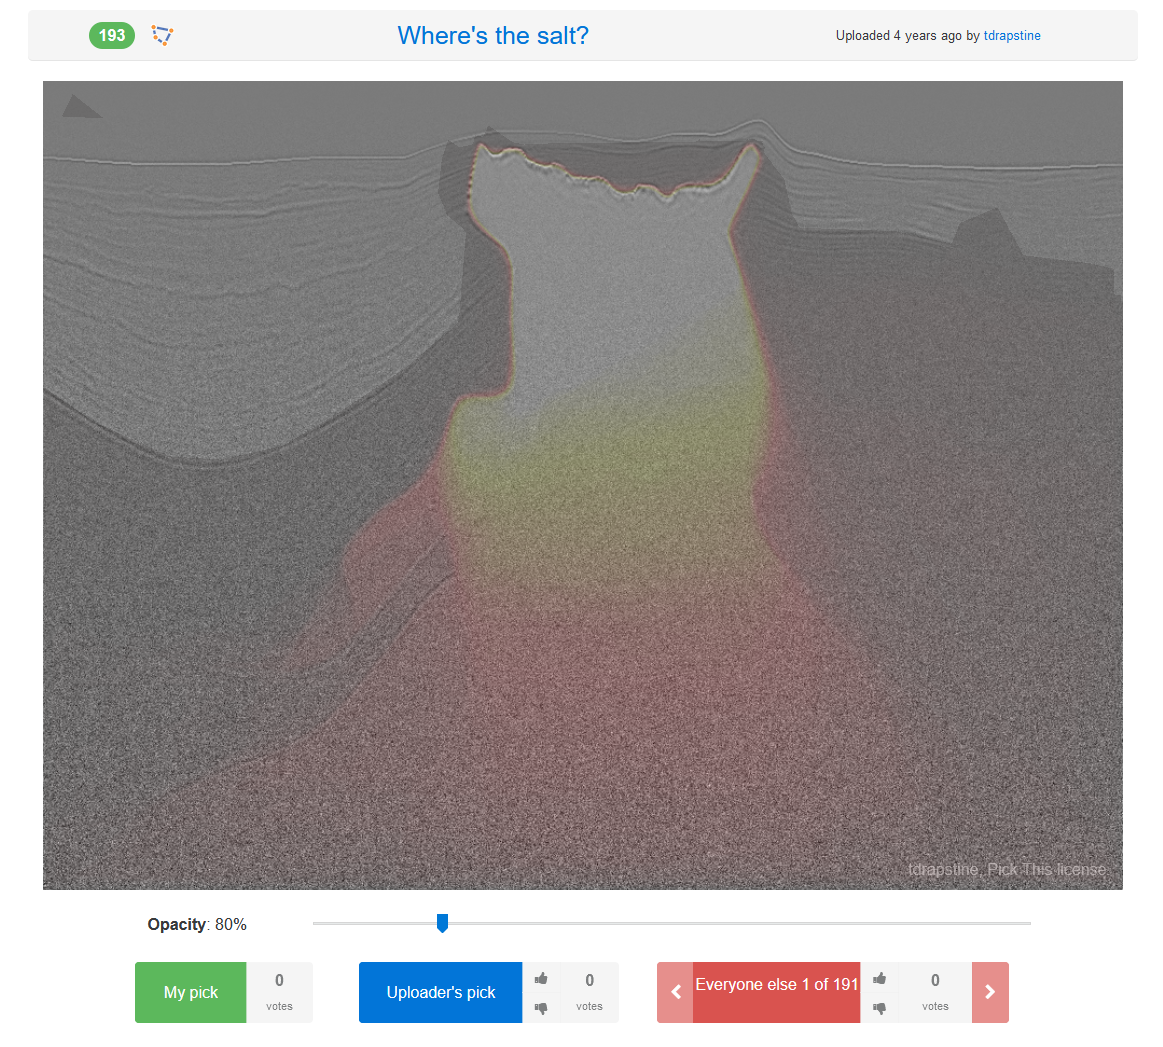
Where’s the salt?
Task: Pick a single consolidated salt body from the depth migrated seismic image.
Description: Image created by slicing and modifying an openly available 3D depth migrated image of the SEAM Phase 1 salt body.
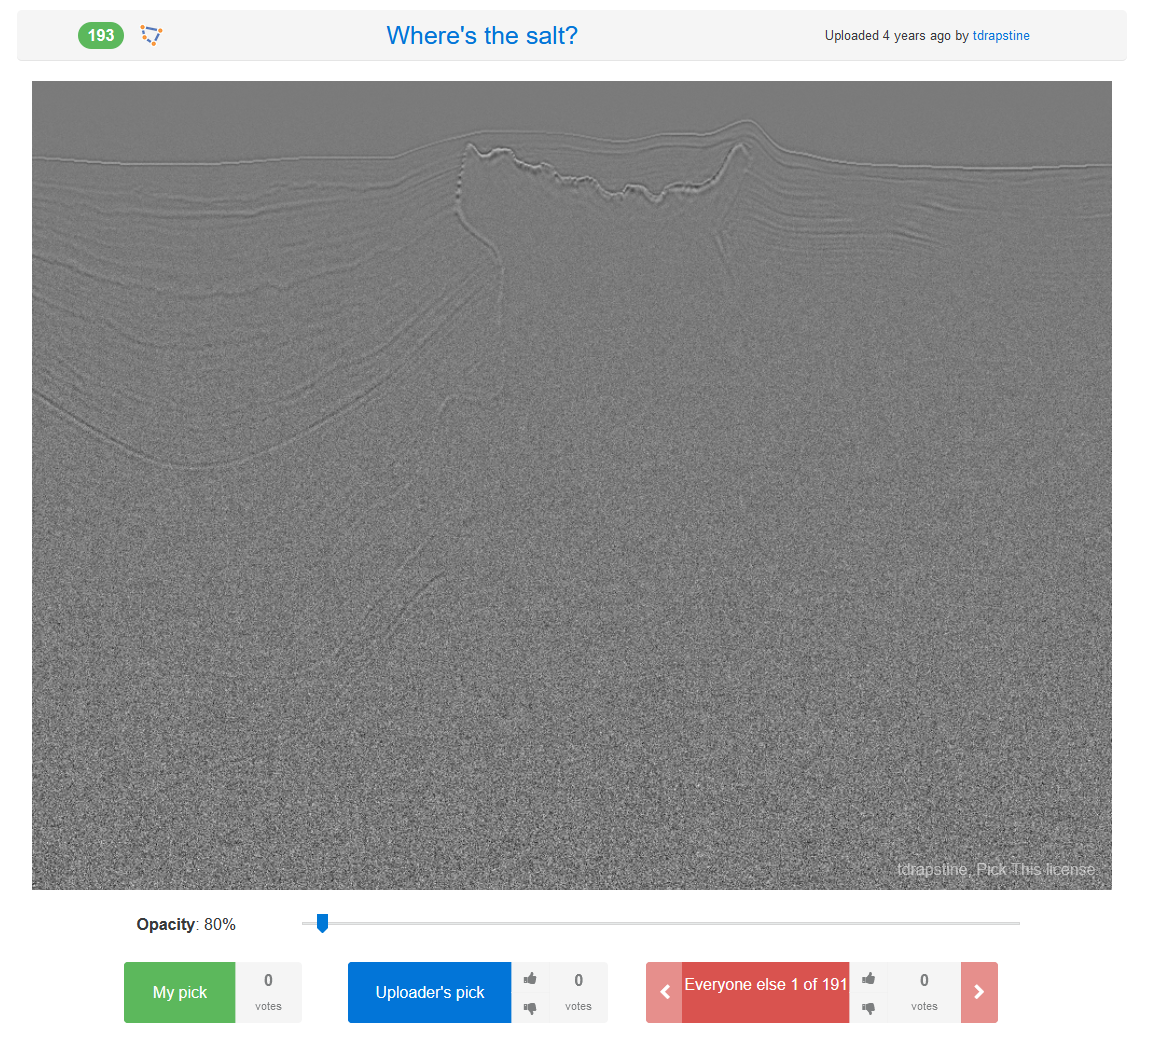
tdrapstine / pickthis.io
Click me!
tdrapstine / pickthis.io
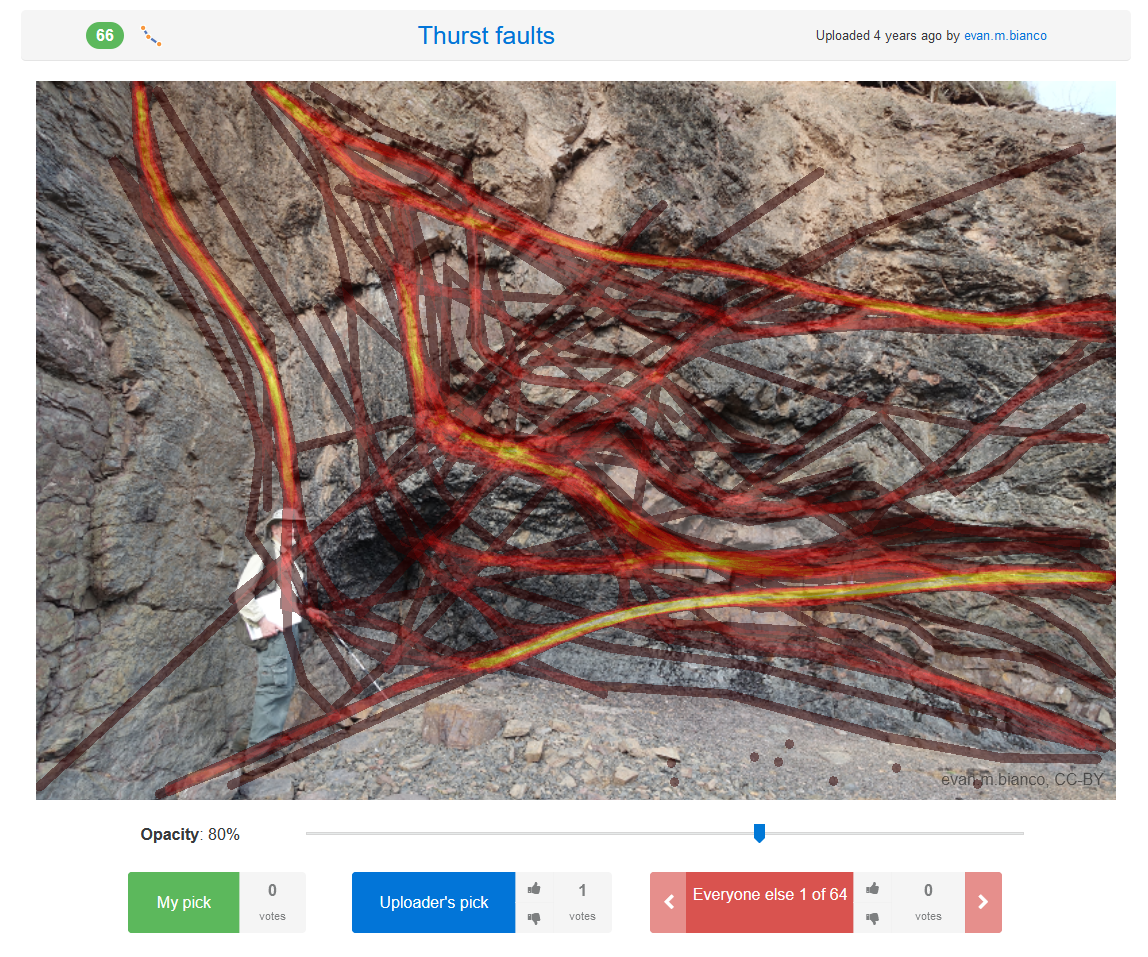
Thrust faults
Task: Pick the thrust fault planes.
Description: Duplicated and folded strata from the Horton Bluff formation at Rainy Cove, Nova Scotia..
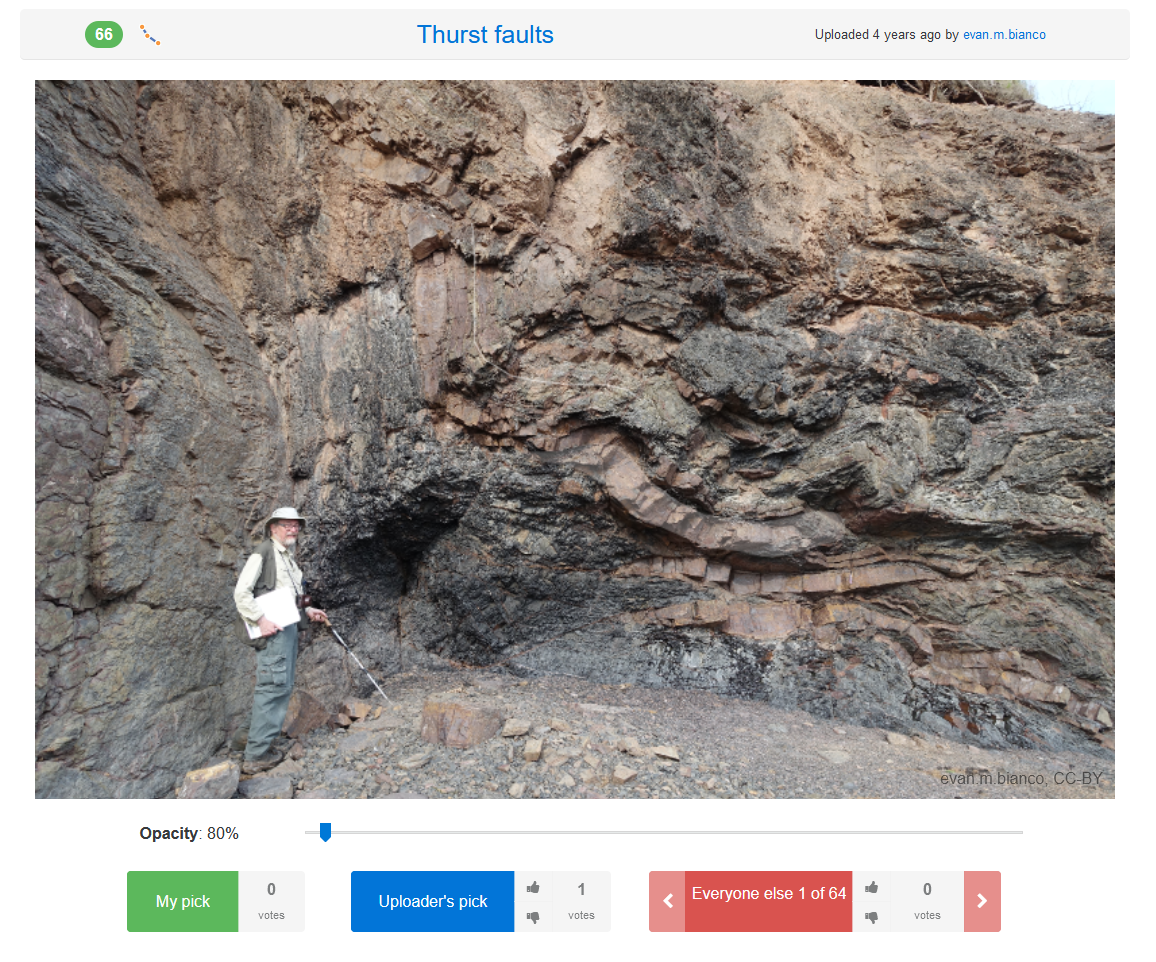
Evan M. Bianco / pickthis.io
Click me!
Evan M. Bianco / pickthis.io